
View trends
To view data in trends, click the
View Data
tab, and then click Trends
.The page allows you to select multiple points and draw a trend chart to view data. Each trend chart provides a visual representation of the data collected over a specific period of time.
To view a trend
- UnderSelect Points For Trend Chart, define your search criteria.For details, see Define search criteria.
- ClickSearch.The data is displayed in thePointstable.
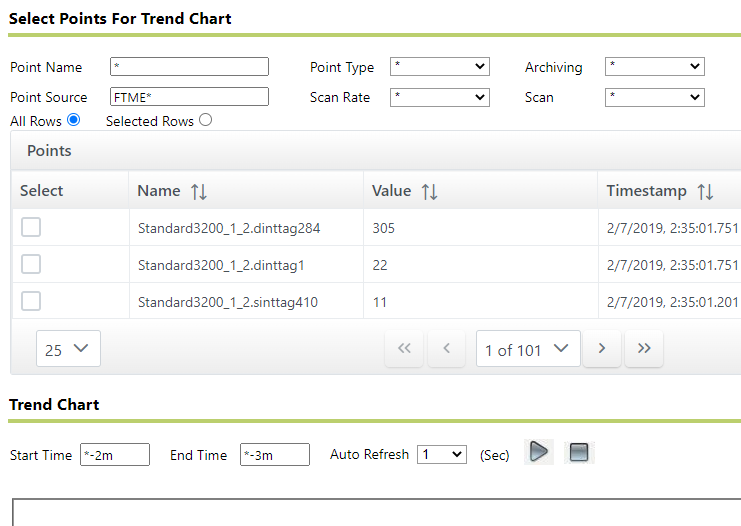
- Select checkboxes in theSelectcolumn next to the points that you want to present on the trend.
- (optional) In theStart TimeandEnd Timeboxes, type the start and end time for the selected point(s).For details, see Set start and end times.
- (optional) Using theAuto Refreshlist, define the frequency with which the data in the trend will be refreshed (in seconds).The default value is 1 second.
- Click
 .The button color changes to grey (
 ). The trend is drawn. The data in the trend is being refreshed with the frequency specified in the Auto Refreshlist.
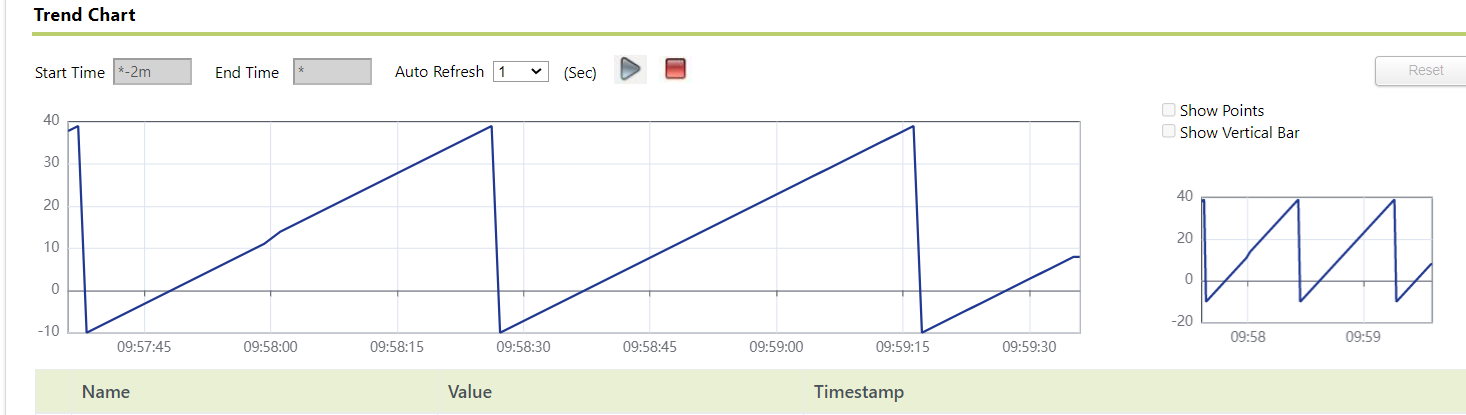 The trend chart displays trends for selected points using colored variants to distinguish between the different points. You will not be able to select the point for viewing in the trend chart until data has been collected for the new point.The numbers on the horizontal axis at the bottom of the chart represent the point timestamps. The numbers on the vertical axis on the left of the chart represent the point values.The small window next to the trend displays the chart in the total time period set by the time parameters.
Provide Feedback