
Display points on the trend
Use the
Show Points
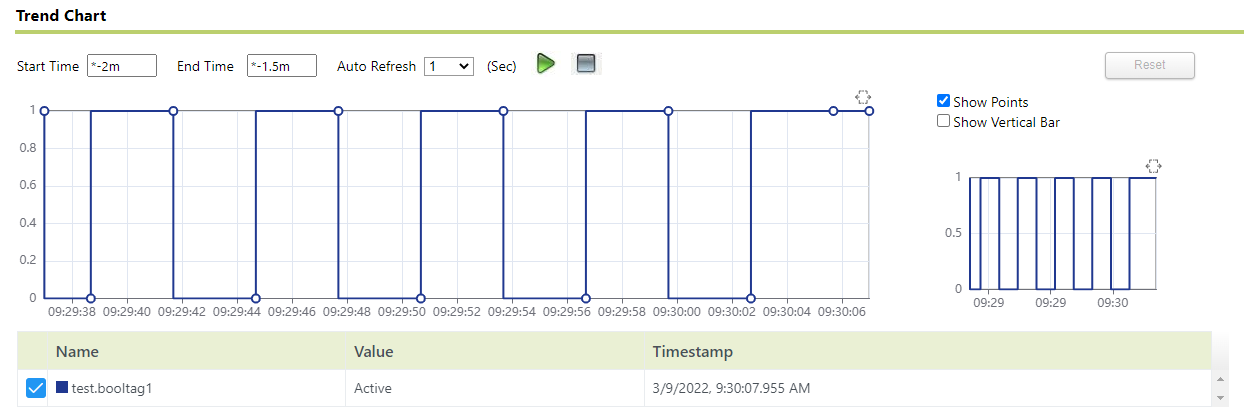
option to display individual points on the trend.To display points on the trend
- Click
 .The button color changes to grey (
 ). The data on the trend is no longer refreshed.
 - Select theShow Pointsoption next to the trend.Individual points are displayed on the trend as small circles.
- Click
 .
. TIP:If you want to draw a trend chart that consists of high-speed points, avoid selecting theShow Pointsoption due to the large number of points that will be displayed.
Provide Feedback