FactoryTalk ViewPoint trend
By default, the trend scrolls older data to the left as it receives new information. Zoom the trend to show more or less data at once, or pan the trend to view data from a specific point in time. When zoomed or panned, the trend stops scrolling but will continue to receive new information from the data server.
Pen colors are pre-defined and do not match the colors set in the
FactoryTalk View
trend object. The first sixteen pens are colored with different shades of blue, red, green, brown, and purple. Any additional pens are black.
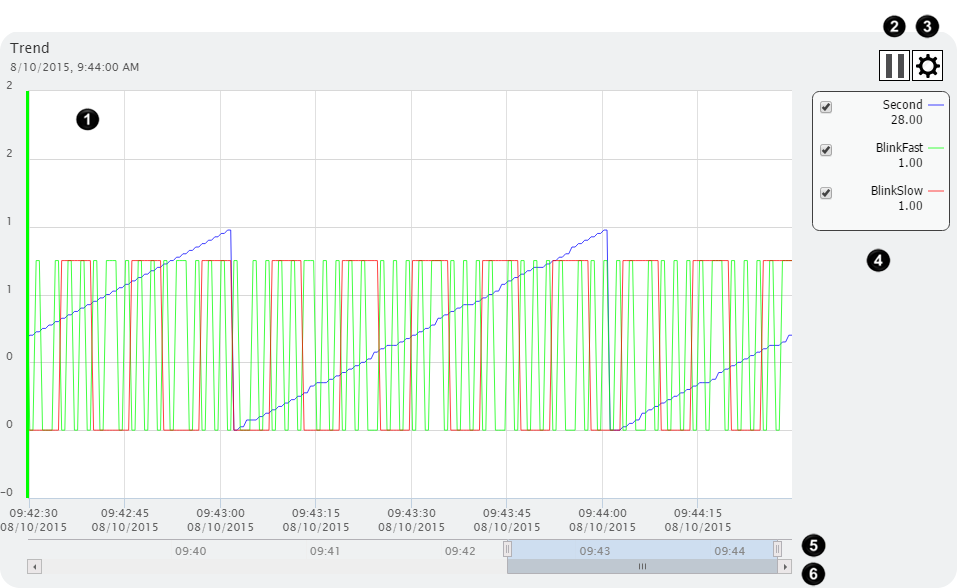
Item | Name | Description |
|---|---|---|
 | Chart | Shows the values of each pen over time. The X axis shows the time span and the Y axis shows the Min and Max values for the selected pen. |
 | Play/Pause button | Plays or pauses the progression of the trend chart. Trends automatically begin in play mode. |
 | Menu button | Opens a menu to access the Trend Configuration window, the Local Cache TimeOut window, or toggle labels on the trend chart. |
 | Legend | Lists the tag name or description, current value, and color for each pen. The pens are defined in the FactoryTalk View Studio trend object.This item is hidden by default. To show this item, click the Menu button and select Show/Hide Legend . |
 | Zoom slider | Increases or decreases the time span of the trend chart. This item is hidden by default. To show this item, click the Menu button and select Show/Hide Slidebar . |
 | Pan slider | Pans the viewed data forward or backward in time. This item is hidden by default. To show this item, click the Menu button and select Show/Hide Slidebar . |
Provide Feedback