Debugging LD programs
Debug Ladder Diagram (LD) programs to monitor the output values of elements. These values
display using color, numeric, or textual values according to their data type:
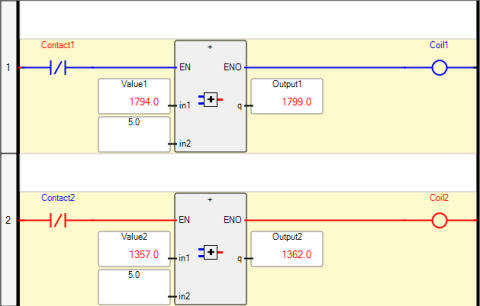
- Output values of Boolean type display using color. The output value color continues to the next input. Boolean elements remain black when the output value is unavailable. The default colors are red when True and blue when False. Customize colors for Boolean items.
- Output values of SINT, USINT, BYTE, INT, UINT, WORD, DINT, UDINT, DWORD, LINT, ULINT, LWORD, REAL, LREAL, TIME, DATE, and STRING type display as a numeric or textual value in the element. The display value is the selected member when the output is a structure type.
For structure-type variables, display one simple-type field.
The WAIT text displays in the output label when the output value for a numeric or textual
value is unavailable. Transitional elements like Pulse rising edge (positive) contacts with
an unstable state remain black. Values also display in the corresponding dictionary
instance.
While simulating an application, debug LD programs with breakpoints, cycle-to-cycle, and
step-by-step execution. Breakpoints, cycle-to-cycle, and step-by-step execution are not
available while connected to controllers. Enable step-by-step execution by generating debug
information for individual program organization units (POUs). The application switches to
step-by-step execution upon encountering a breakpoint when debug information is generated
for LD programs. Set breakpoints to rungs to instantiate step-by-step execution. The
application stops upon encountering a breakpoint when debugging. At this time, the
application is in the DEBUGGING state and these operations are available:
- Step into the next rung, executes the next rung then steps into the subsequent rung. When the next rung includes a call to a function, stepping continues in the called function then returns to the next rung in the POU.
- Step over the next rung, executes the current rung then steps to the next rung
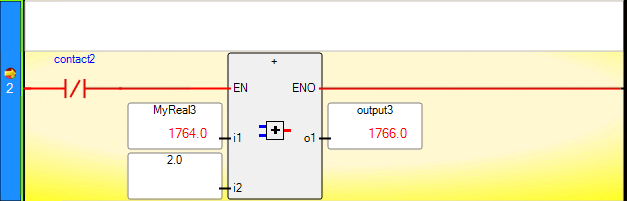
Breakpoints appear as red circles to the left of the rung in the language editor. A yellow
arrow displays on the breakpoint and the next rung highlights in yellow when the application
encounters a breakpoint.
The arrow points downward when stepping passes beyond the last rung of a POU.
While debugging, toggle the Boolean logical value of a selected contact, coil, or function
block input.
Task | Procedure |
|---|---|
Generate debug information for an LD POU | Only available for simulation.
|
Set breakpoints in an LD POU | Only available for simulation.
TIP:
Setting a breakpoint in a POU during simulation checks
out the POU once the simulation stops.
|
Remove breakpoints | Only available for simulation. Remove breakpoints in the RUNNING state or
cycle-to-cycle execution while simulating. Select the rung or rungs requiring the removal of breakpoints, right-click the
rung area, and then click Remove Breakpoint . |
Toggle the logical value of a contact coil or block input variable | Available for simulation and running online connected to controllers. Select the required element, then right-click Toggle Boolean Value (or
press Ctrl+T ). |
Step into the next rung | Only available for simulation.
|
Step over the next rung | Only available for simulation.
|
 (or press
  (or press F10).
TIP:
Set and remove breakpoints in the RUNNING state or
cycle-to-cycle execution while simulating.
Provide Feedback