Access diagnostic information
To access the Diagnostic tool
From the Application View, right-click the device and then click
Diagnostic
.The
Diagnostic
tool displays a high-level overview of the Trusted®
application. Use Diagnostic
tool to access diagnostic information like the application state, last application error, various values for the cycle time, and the target and AADvance-Trusted SIS Workstation software®
versions. Communications between the AADvance-Trusted SIS Workstation software
and target must be established to display the diagnostic information. When connected to the application, refresh the Diagnostic
tool to update the displayed information.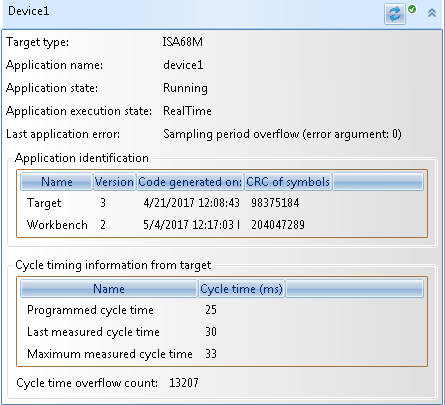
Diagnostic information that displays in the
Diagnostic
tool:Information | Description | |
|---|---|---|
Target type | The type of target. For Trusted applications, the possible value is ISA68M. When simulating, the possible value is ISA86M. | |
Application name | The name of the Trusted application. | |
Application state | The state of the Trusted application. Possible values are Running, Stopped, or Error. | |
Application execution state | The execution state of the Trusted application. Possible values are RealTime or CycleToCycle . | |
Last application error | Displays the last application error message or none if no application error occurred.
TIP:
If the
Output window displays the
application error before you open the Diagnostic tool, the Last
application error is none . | |
Application identification | ||
Target | Displays the target version, generation date and time of the target code, and the CRC symbols value. | |
Workbench | Displays the version, the generation date and time of the code, and the CRC symbols value. | |
Cycle timing information from target | ||
Programmed cycle time | The cycle time defined for the device, in milliseconds. Define the programmed cycle time using the Cycle Timing (ms) property in the Properties window. | |
Last measured cycle time | The real cycle time of the last application cycle, in milliseconds. | |
Maximum measured cycle time | The longest period of time used for a cycle since connecting with the Trusted application. | |
Cycle time overflow count | The number of cycles having exceeded the programmed cycle time. | |
Refresh the information that displays in the
Diagnostic
tool . When communications between the AADvance-Trusted SIS Workstation software
and target are established, the Diagnostic
tool displays the last readings from the target. When connected to the application, refresh the Diagnostic
tool to update the displayed information.Icons that display status of the data in the
Diagnostic
tool : | Refresh is in progress. |
 | Refresh was successful. |
 | There was an error refreshing the information. The error is usually due to a connect attempt failure. |
To refresh the information displayed in the Diagnostic tool
- From theDiagnostictool, click
 .
.
Provide Feedback