IsolatedGraphing property
Returns or sets whether the chart lines are drawn in individual graphs or all in one graph. Read/write. Boolean.
Syntax
yaxis
.IsolatedGraphingMode
[ = state
]where
yaxis
- is a YAxis object, or an expression that evaluates to a YAxis object.state
- is a parameter of the type Boolean that can be set to one of the following:- True. Displays each trend line separately
- False. Displays all the trend lines together
Remarks
Plots each pen in a separate band of a trend chart.
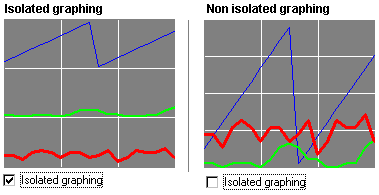
Select isolated or non-isolated graphing on the Trend properties Y-Axis tab.
Provide Feedback