Deviation Grouping
The FactoryTalk Analytics GuardianAI application uses high-resolution three-phase current data as an input and builds a unique fingerprint (cluster) to the deviation. Deviations belonging within the same cluster will be shown as a group with a plot displaying each detected event. One point in the plot represents a deviation event. The user can use the plot to hover over a given point to examine additional details regarding the time of occurrence.
Deviation Grouping Plot
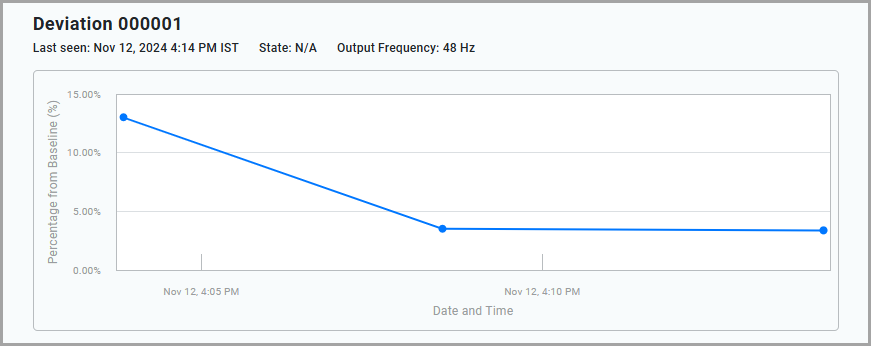
Suppose a pump starts cavitating at 1 am on a Saturday, and the user doesn’t come in to view the anomaly until Monday. In that case, the plot will gather additional points to illustrate the continuation of the cavitation event. This grouping mechanism makes it much easier to discern different types of deviations from one another.
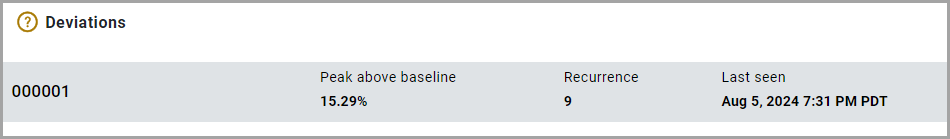
The deviation line item will display a high-level summary of the grouping, including a unique identifier, maximum peak above baseline, the number of recurrences, and the last timestamp at which this deviation pattern was detected.
Deviation Summary
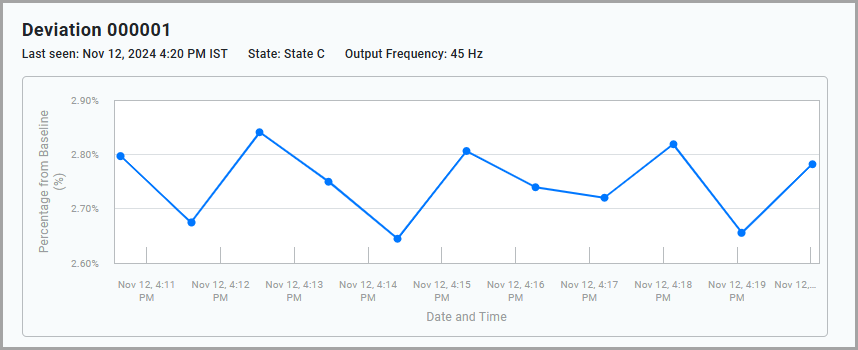
If there are multiple states, a separate deviation line item is displayed for each state. In other words, all the deviation associated to all the states will be displayed under
Deviations
section.When the user selects a particular deviation item, the associated deviation grouping plot is displayed.
Provide Feedback