Strategic Growth Framework

January
February
March
April
May
June
July
August
September
October
November
December
Rockwell Automation, Inc. (NYSE: ROK)
NYSE: ROK
Faster secular growth
Share growth and expanded market

ARR (Recurring Software & Services)
Acquisitions
TOTAL ANNUAL GROWTH THROUGH THE CYCLE
LONG-TERM
FINANCIAL FRAMEWORK
- 35% core earnings conversion
- EPS growth > sales growth
- FCF conversion ~100%
- ROIC > 20%
- Target 2x leverage
Margin Expansion
| Margin Growth Drivers | Medium-term Range* | |
|---|---|---|
| Intelligent Devices |
|
22% - 24% |
| Software & Control |
|
31% - 34% |
| Lifecycle Services |
|
13% - 15% |
| Total ROK | Operational Excellence & Continuous Improvement | Price discipline | Accelerated top line growth |
|---|
*Targets introduced in 2023; Excludes impact of future acquisitions
Operationalizing Margin Expansion and Continuous Improvement
ROK Operating Model to drive margin expansion and productivity through FY26 and beyond
Incremental YOY Benefit

Key Levers for FY26 Productivity
| Enterprise Scale and Efficiency | Product Cost Reduction | Logistics | Insourcing/Vertical Integration | Manufacturing Efficiency |
|---|---|---|---|---|
| Lifecycle Services process efficiency | Direct material sourcing | Air to ocean | Plastic molding | Line optimization |
| Clearpath profitability | Product redesign | In region for region | Finished good sub-assemblies | Labor cost reduction |
| Functional productivity | ROK on ROK | Transportation Management System | Outside services | Quality improvement |
$2B Investment to Drive Customer Value and Expand Margins
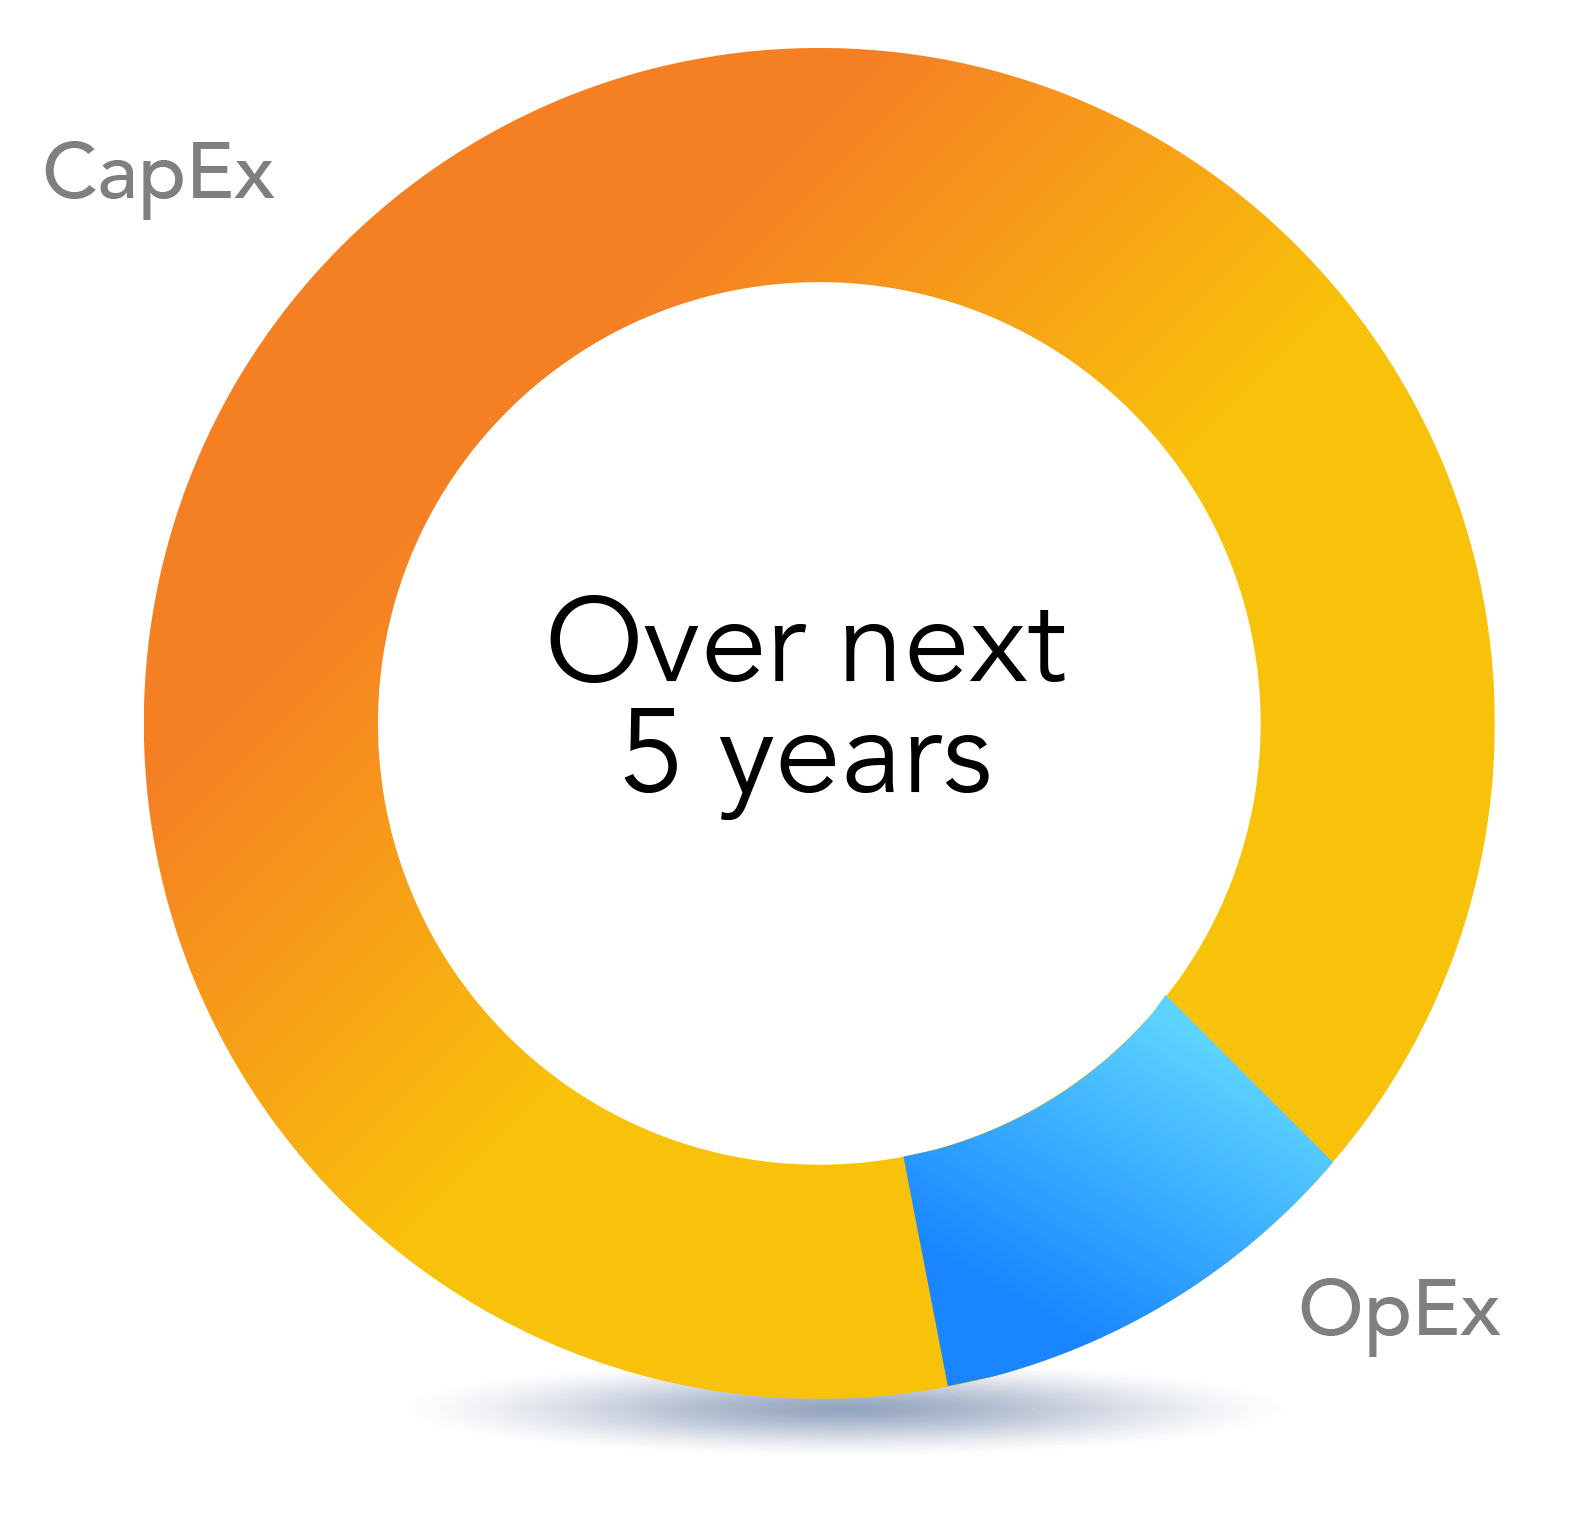
Modernizing infrastructure, growing talent, and enhancing digital capabilities
- Efficiency in existing and new plants
- New brick and mortar in the US
- AI-native talent: data science & cybersecurity
- Customer-facing resources to fuel growth
- Secure, intelligent operations at the edge
- AI-first IT infrastructure
Inorganic Investments
Introduced in 2025
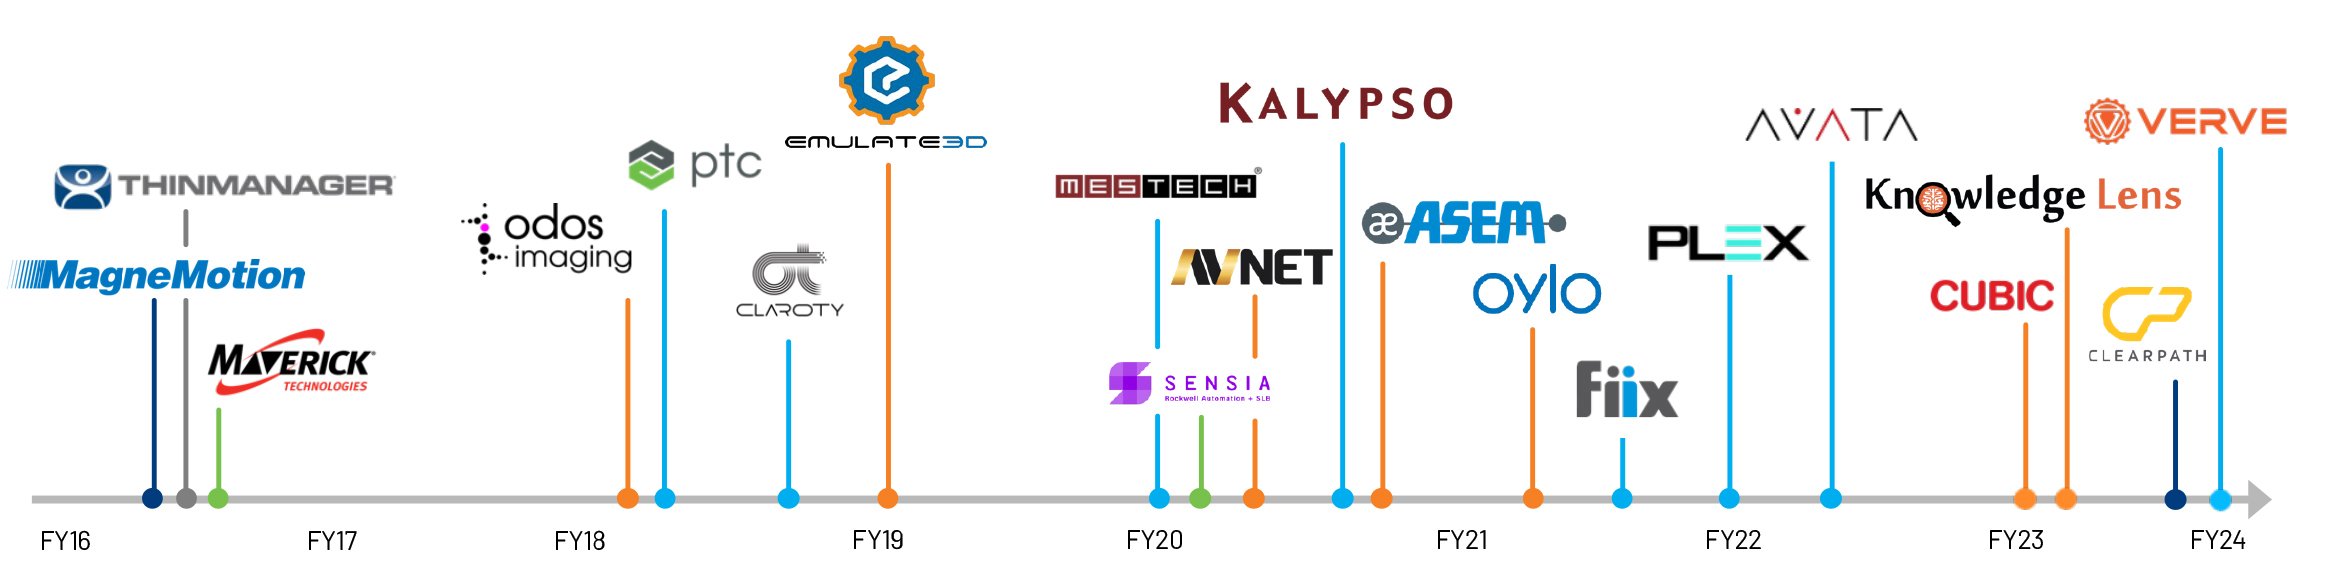
Inorganic
priorities
Industrial AI Applications
Market Access in Europe / Asia
Product Portfolio Expansion
Prior inorganic
priorities
Process Expertise
Information Solutions / Connected Services
Market Access in Europe / Asia
Advanced Material Handling
Capital Deployment
Our strong balance sheet provides us with significant flexibility and capacity to deploy capital. Our capital deployment priorities have not changed: make investments to fund organic growth, drive a point or more per year of growth from strategic acquisitions, and return excess cash to shareowners through dividends and share repurchases.
ORGANIC INVESTMENTS
Operating Cash Flow
Capital Expenditures
~2.5 to 4% of Sales
Free Cash Flow
~100% of Adjusted Income
INORGANIC INVESTMENTS
Acquisitions
Target ~1 pt of growth per year
EXCESS CASH RETURNED TO SHAREOWNERS
Dividends
Maintain “A” credit rating
Share Repurchases
Framework for Continued Superior Financial Returns
Our longer-term framework for financial performance starts with organic sales growth, which drives earnings conversion (incremental margins). Free cash flow conversion of 100% or more and a strong balance sheet provide significant capacity for strategic capital deployment, including acquisitions and share repurchases. As a result, we expect EPS growth to outpace revenue growth and ROIC to remain over 20%.