
Widgets and Charts
On the dashboard, users can view the data in charts and widgets.
- Change View: The application allows users to change the view from Charts to Widgets and vice versa.
- Click the [
 ] icon to view the chart in the widget view. Click the [
 ] icon to switch the view from widget to chart.Chart View
 Widget View
- For the harmonized and donut charts, the application does not display the non-energy resource type calculations.
- Dynamic Dashboard: Node-level dashboards use dynamic widgets that display only the parameters configured for the selected node. Widgets for unconfigured parameters are automatically hidden, ensuring that the dashboard presents only relevant and available data.
- Default Units: The consumption charts display the default units in tooltips and chart tables for node-level dashboards, for resource charts such as energy, cost, and emissions, covering all resource and utility types based on configuration.NOTE:If the user changes the unit in the configuration, then the change is immediately reflected in the dashboard.Default Units - Consumption Charts
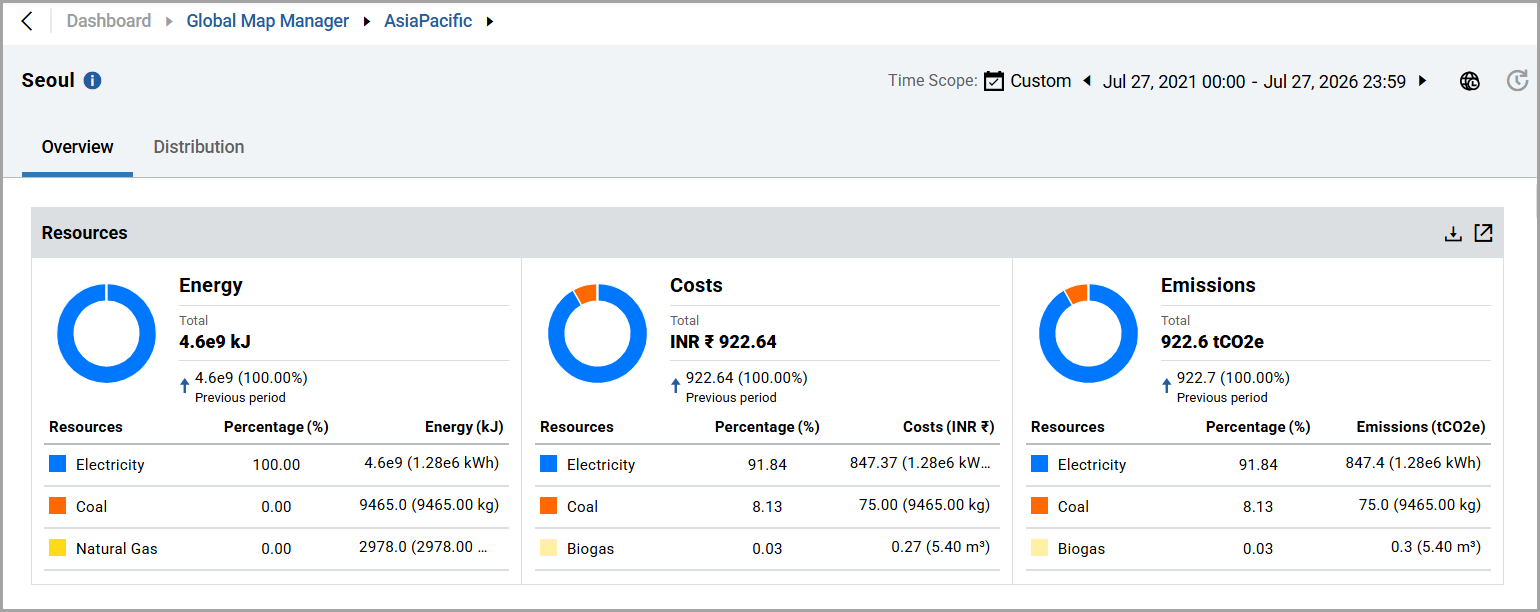
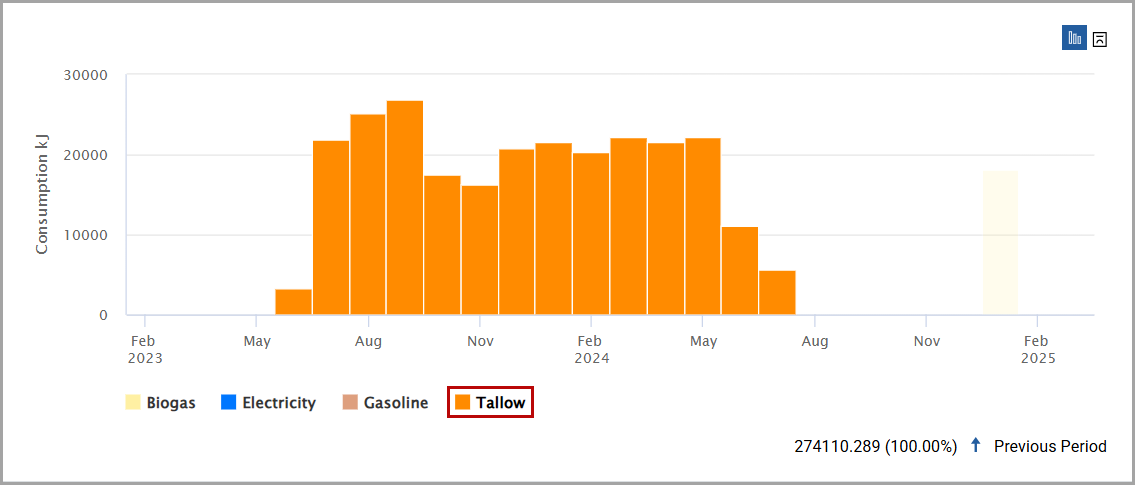
- Hide/Show: On a chart, user can hide/show the data using legends:
- Hover the mouse pointer on a legend to see only the particular data on the charts.Highlight the Data
- Click a legend to hide the data from the charts.Hide the Data
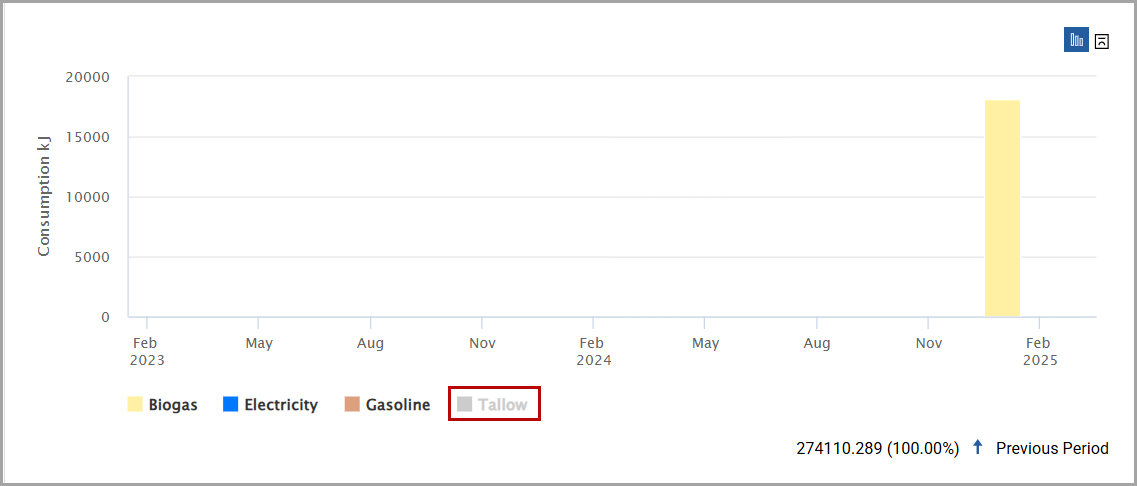 These actions are temporary. Once the dashboard is refreshed, the data is displayed as usual.
- View Data Points: To see the data, hover the mouse pointer over a datapoint.
- By default, up to 2 decimal places are displayed along with default units.NOTE:To change the decimal places, go toSites>Configurations>Measurandssection.View Data

- For the cost chart, if the currency value exceeds 999,999, then the values are represented in millions and billions, such as 1M or 5.65 B.Cost Value Notation

- In the other charts, if the value exceeds 999,999, then the values are represented in Exponential Notation, such as 1e6.Hover the mouse on the chart to see the original values. If this value is beyond 14 characters, then you see the exponential notation.Exponential Notation

- The peak and min values are displayed in the chart for selected time scopes.Peak and Minimum Values

- Expand View: In some dashboards, the user can see the Expand option.Expand Chart

- Click the [
 ] icon to expand the chart.Expanded View
- Click the [X] icon to close the chart.
- Heatmap Chart Tooltips
- Data point values are not displayed in the chart.
- For the past timestamps with missing data, "No Data" is displayed in the tooltip.Heat Map - No Data

- Whereas, for the future timestamps with missing data, "NA" is displayed in the tooltip.NA Data
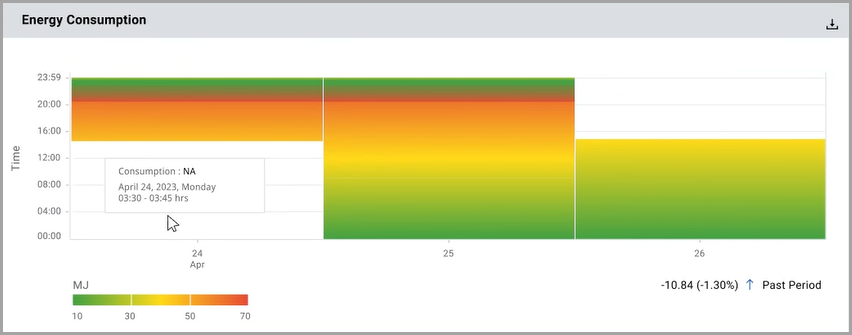
NOTE:Heatmap chart tooltips are applicable for Site, Area, and Work Center.
Provide Feedback