Trend chart contents
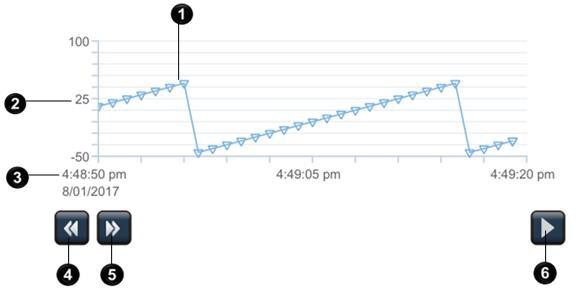
A trend chart depicts data on up to eight traces and plots those values across the chart:
Item | Description |
 | Traces on the trend chart consist of lines and markers. Each trace plots the values of the tag in the controller over the specified time span. Trend charts can display up to eight traces. The trend chart updates every second to display the most recent values, even if there are no values plotted during that time span. |
 | The y-axis that represents data. This axis displays the values of the MinValue and MaxValue properties of the trend chart. |
 | The axis that represents time. The value on the right side of this axis represents the current time. The value on the left side of this axis represents the current time minus the time span. The date corresponds to the left most data point. |
 | Pan Backward  displays previous data one half time span at a time. This button appears only when there is data collected prior to the data displayed on the trend chart. displays previous data one half time span at a time. This button appears only when there is data collected prior to the data displayed on the trend chart. |
 | Pan Forward  displays more recent data one half time span at a time. This button appears only when there is data collected after the data displayed on the trend chart. displays more recent data one half time span at a time. This button appears only when there is data collected after the data displayed on the trend chart. |
 | Resume  updates data after the trend chart is paused. updates data after the trend chart is paused. Pause  replaces replaces Resume  when the trend chart is scrolling. When a trend chart pauses, data does not update and the trend chart is static. when the trend chart is scrolling. When a trend chart pauses, data does not update and the trend chart is static. |
Provide Feedback