Deviation
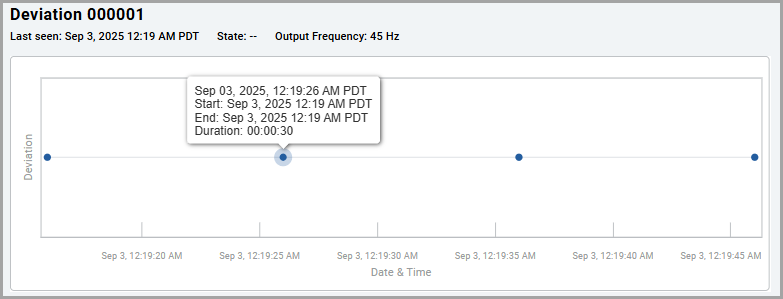
The FactoryTalk Analytics GuardianAI application uses high-resolution three-phase current
data as an input and builds a unique fingerprint (cluster) to the deviation. Deviations
belonging within the same cluster will form as a group and a plot is displayed for each
detected event. One point in the plot represents a deviation event. The user can use the plot
to hover over a given point to examine additional details regarding the time of occurrence,
start, end and duration.
Deviation Plot
Suppose a pump starts cavitating at 1 AM on a Saturday, and the user does not come in to view
the anomaly until Monday. In that case, the plot will gather additional points to illustrate
the continuation of the cavitation event.
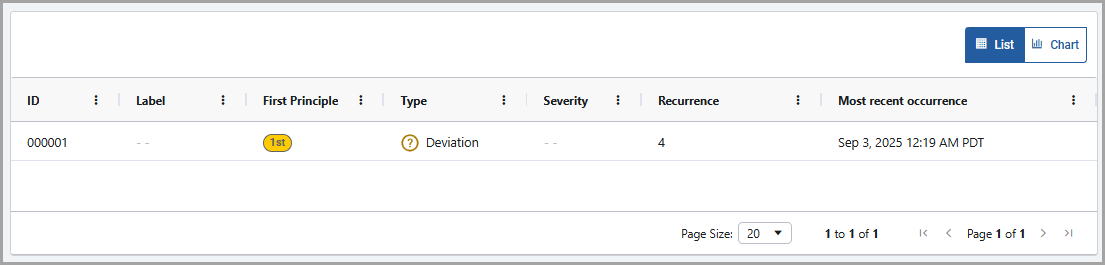
The deviation line item will display a high-level summary of the grouping, including a unique
identifier, indicates whether it is first principle or not, type, the number of recurrences,
and the timestamp of the most recent occurrence at which this deviation pattern was detected.
The deviation summary can be viewed in two formats. List and Chart. Select the required option
to choose the format. The below screens provide an overview of List and Chart views.
Deviation Summary - List View
Deviation Summary - Chart View
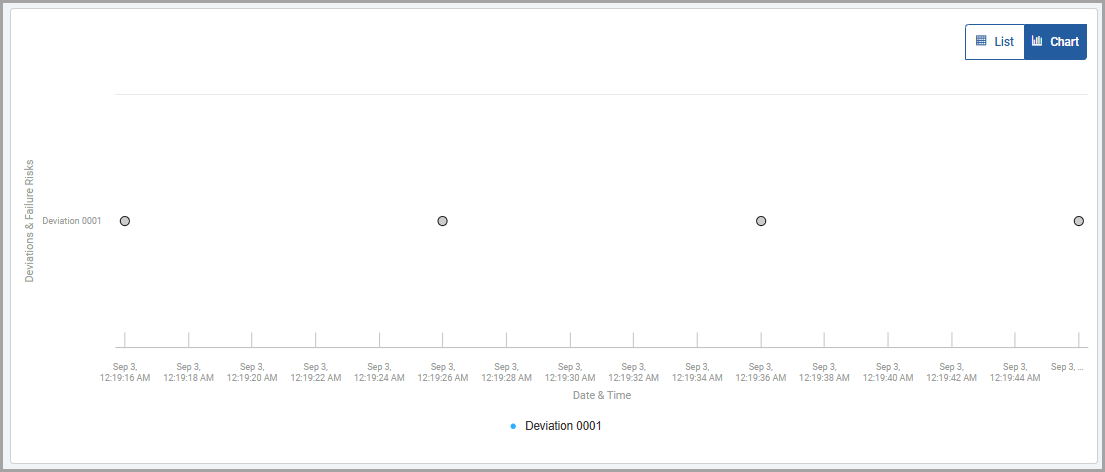
When the user selects a particular deviation item, the associated deviation plot is
displayed.
Provide Feedback