Create Dataset
Perform the following steps to create a Dataset with a Dataset:
- Navigate to the Connections tab and select the folder where the connection is added.
- Click the [
 ] icon and click [Add Dataset].Add Dataset
 Add Dataset
 - The Add Dataset page displays. Provide the following details:NOTE:The Dataset properties may vary based on Connection types. Refer to the FactoryTalk Analytics DataView Connectors Configuration Guide for further details.
- Dataset Name: Provide a unique Dataset name.NOTE:If the Dataset with the provided name is already created, an error message displays.Dataset Name

- Connection Name: Displays the selected Connection Name.
- Direct Query: Toggle the [Direct Query] option using the slider to enable Direct Query. Refer to Direct Query Dataset for further details.
- Direct Query is a mechanism to fetch the updated data directly from the data source (i.e. connector).
- When Direct Query feature is enabled, the Storyboard data will not be stored in Elasticsearch.
Direct Query When Direct Query enabled the following features are not supported:
FeaturesDescriptionStoryboardData Sync ConfigurationThe data is always fetched directly from DB and not from Elasticsearch index, so data sync is not applicable.Data Retention ConfigurationAs there is no Elasticsearch index for Storyboards with direct query option, there is no relevance of Data Retention.Last Sync timeThe Data sync option is disabled for Direct Query Storyboard. In Quick Info section it displays as Direct Query under the Last Sync Time column.ChartField Aggregations - VarianceIn Attributes section, the 'Variance' option is not available for X-Axis and Y-Axis numeric value.Field Aggregations- Standard DeviationIn Attributes section, the 'Standard Deviation' option is not available for X-Axis and Y-Axis numeric value.Field Aggregations- Sum of SquaresIn Attributes section, the 'Sum of Squares' option is not available for X-Axis and Y-Axis numeric value.Field Aggregations- PercentileIn Attributes section, the 'Percentile' option is not available for X-Axis and Y-Axis numeric value.Field Aggregations- MedianIn Attributes section, the 'Median' option is not available for X-Axis and Y-Axis numeric value.NOTE:When direct query is enabled, the Custom Value option is not available for Gauge chart.Select Dataset - Select the desired database object from any one of the following options:
- Tables & Views
- Drag and drop the desired data tables from the list.(OR)Select the desired data tables from the list and click [Add Select Data] to the Selected data section.Select Tables

- Stored Procedure
- User can select index from Stored Procedures.Stored Procedure

- Click [Next] the Customize Data page display.
- Enter the appropriate values and click [Next].Stored Procedure

- Custom Query
- Select [Custom Queries] and write the Custom Query in the “Enter queries below” area.Custom Query
 NOTE:If Custom Query has same column names from different tables in select clause, application is giving an error on Preview Dataset page, however, the Preview Dataset page displays with full data, if the alias name is used in the select.For example:SELECT Books.CategoryId, Books.Name, Categories.Id, Categories.Name as cName FROM Books INNER JOIN Categories ON Books.CategoryId = Categories.Id
 - Click [Validate] the“Query validated successfully”message displays if the expression is valid.Custom Query Validated

- Click [Next]. The Customize Data page displays.NOTE:For Dataset with custom query the“For Custom Queries, data customization is not applicable. Click [Next] to continue”message displays.
- Click [Add Join] to generate multiple joins and select the respective columns from table with primary key and foreign key relationship.Customize Data
 DataView allows user to add or delete the joins:
- The associations (joins) among the tables displays. User can select the type of Joins.
- Table joins allow Users to create Views based on the data.
- Users can also select columns from the tables to create additional associations.
User can also delete the generated joins:- Click [Delete All] a warning message displays. Click [YES] to delete all the joins.Customize Data

- Click [Next] the Modify Entities page displays.
- Select the Source Time Zone from the drop-down list.
- Select one column name as a unique id in the Unique_ID column.
- User can change the column display name on the Modified entities page, and the same name displays in all sections of the dataset. The same name displays on the Preview dataset page and Configuration page while creating a dataset. On the Storyboard created with the dataset, the same column name displays in Chart settings, filters, legend series, tooltip, Sorting & Ranking, etc.
- Select the desired columns to generate the Dataset.NOTE:Dataset created with custom query will not have Unique ID column.
- Click the [
 ] icon to uncheck all the visible columns.Modify Entities
- Click [Next]. The Preview Dataset page displays the date and time as per selected Time Zone in the Modify Entities page.
- Hover the mouse over the column header and click the [
 ] icon to sort the data or arrange the column size or to apply aggregation.NOTE:User needs to select the [Group by <column_name>] on numeric field to view the aggregation option.Preview Dataset
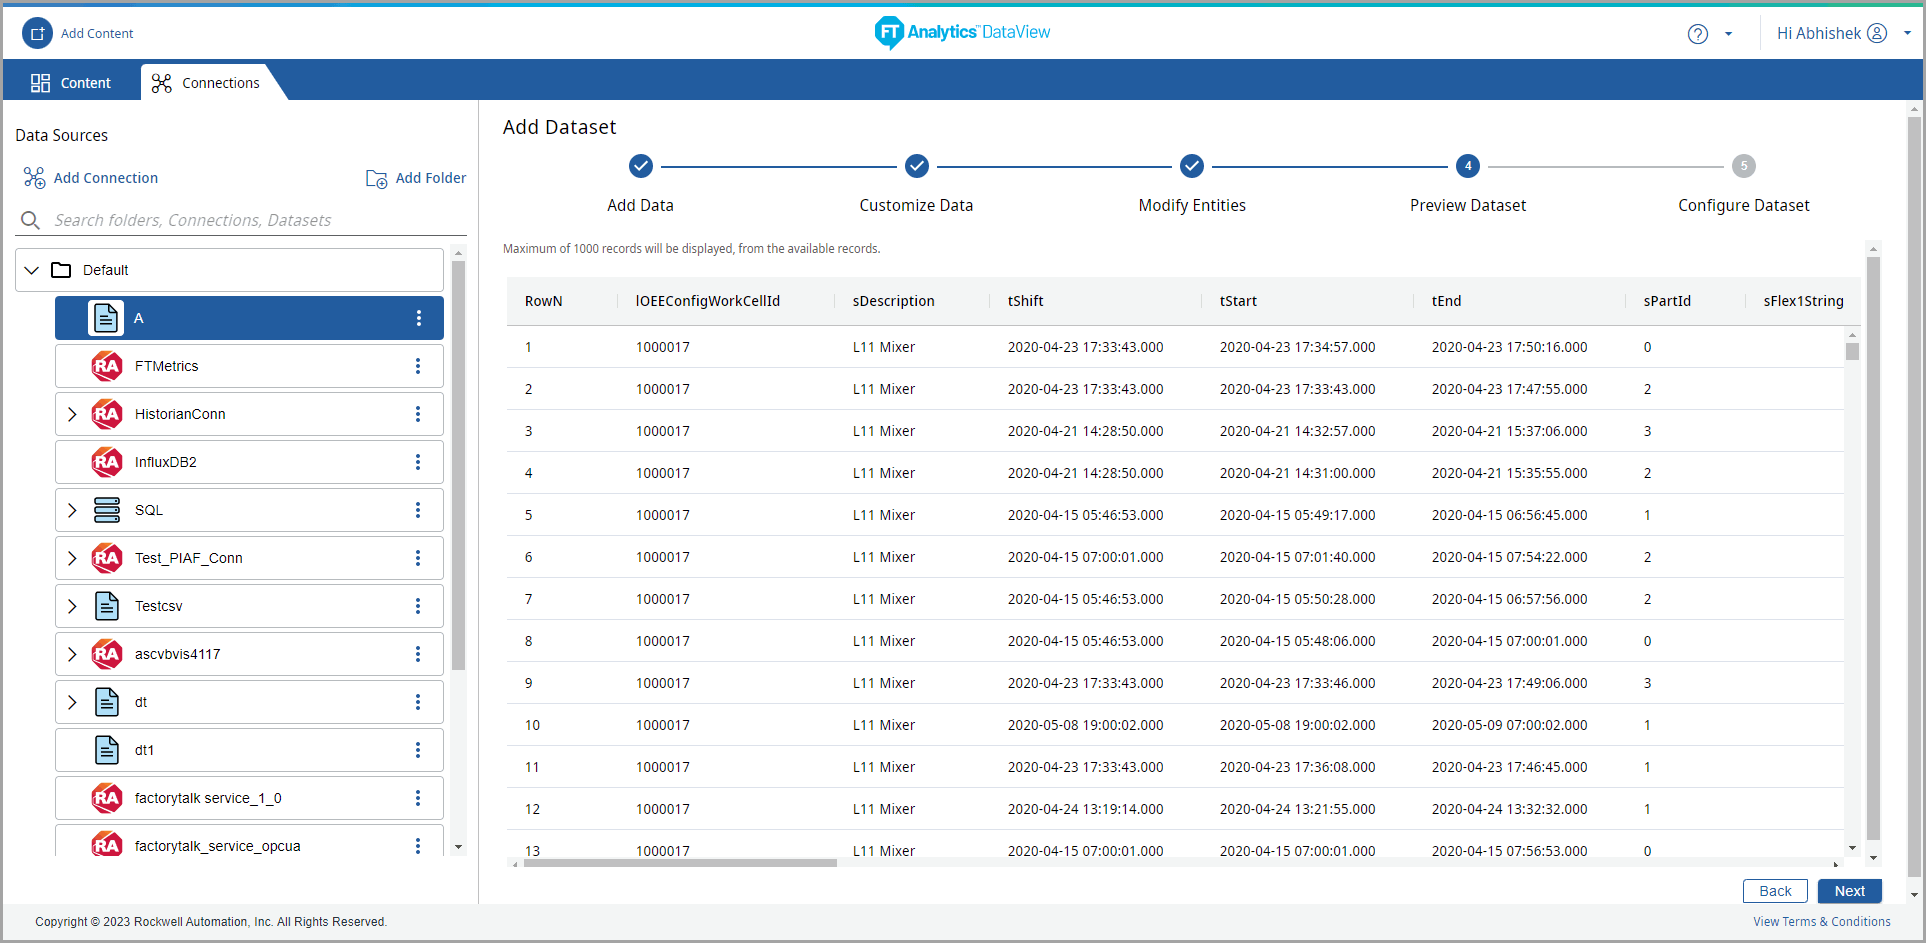
- To apply aggregation on the column that has numeric value:
- Hover the mouse over the column header and click the [] icon and then click [Group by <column_name>].Group by Group
 The ‘Value Aggregation’ option displays.
 - Click [Value Aggregation] and select the aggregation from the drop-down list.Select Aggregation
 NOTE:If the table contains numeric data in format like 1, 2, 3, 10, 12, 13, 22, 23, 24, 99, 100 and user tries to apply the filter then the data displays in the following sequence: 1, 10, 100, 12, 13, 2, 22, 23, 24, 99.
- Hover the mouse over the column header and click the [] icon.
- Click the [
 ] icon and select the columns to filter the data.Select Filter
- Click [Next].
- The Configure Dataset page displays. Provide the following details:
- Data Sync Configuration: Select All Data or Selected Data (data for the Views).
- All Data: Select the following:
- Full Refresh: Display updates only after the entire data is updated.TIP:After deploying the application, when the User creates the first Storyboard with Incremental Refresh option, empty storyboard is saved. However, the Storyboard will be saved with full data, if user creates a full refresh Storyboard and then switches to Incremental Refresh.Configure Data Sync - All Data - Full Refresh

- Incremental Refresh: Display updates only additional data for a specific entity. Select the column(s) from the drop-down list to update the data.NOTE:For a Storyboard with Custom Query, do not select the column with alias name for Incremental Refresh. This is because the alias name column does not exists in database, it displays error.Configure Data Sync - All Data - Incremental Refresh
 NOTE:Only full refresh is applicable for Storyboard created with store procedure.Configure Incremental refresh for all the connectors. Always insert Max ID+1 into the database.Example: In a table, if one column contains 1, 2, 3 IDs, and if User needs to add some more records for checking data sync, then User should insert the column ID as 4 which is greater than the last max value 3.
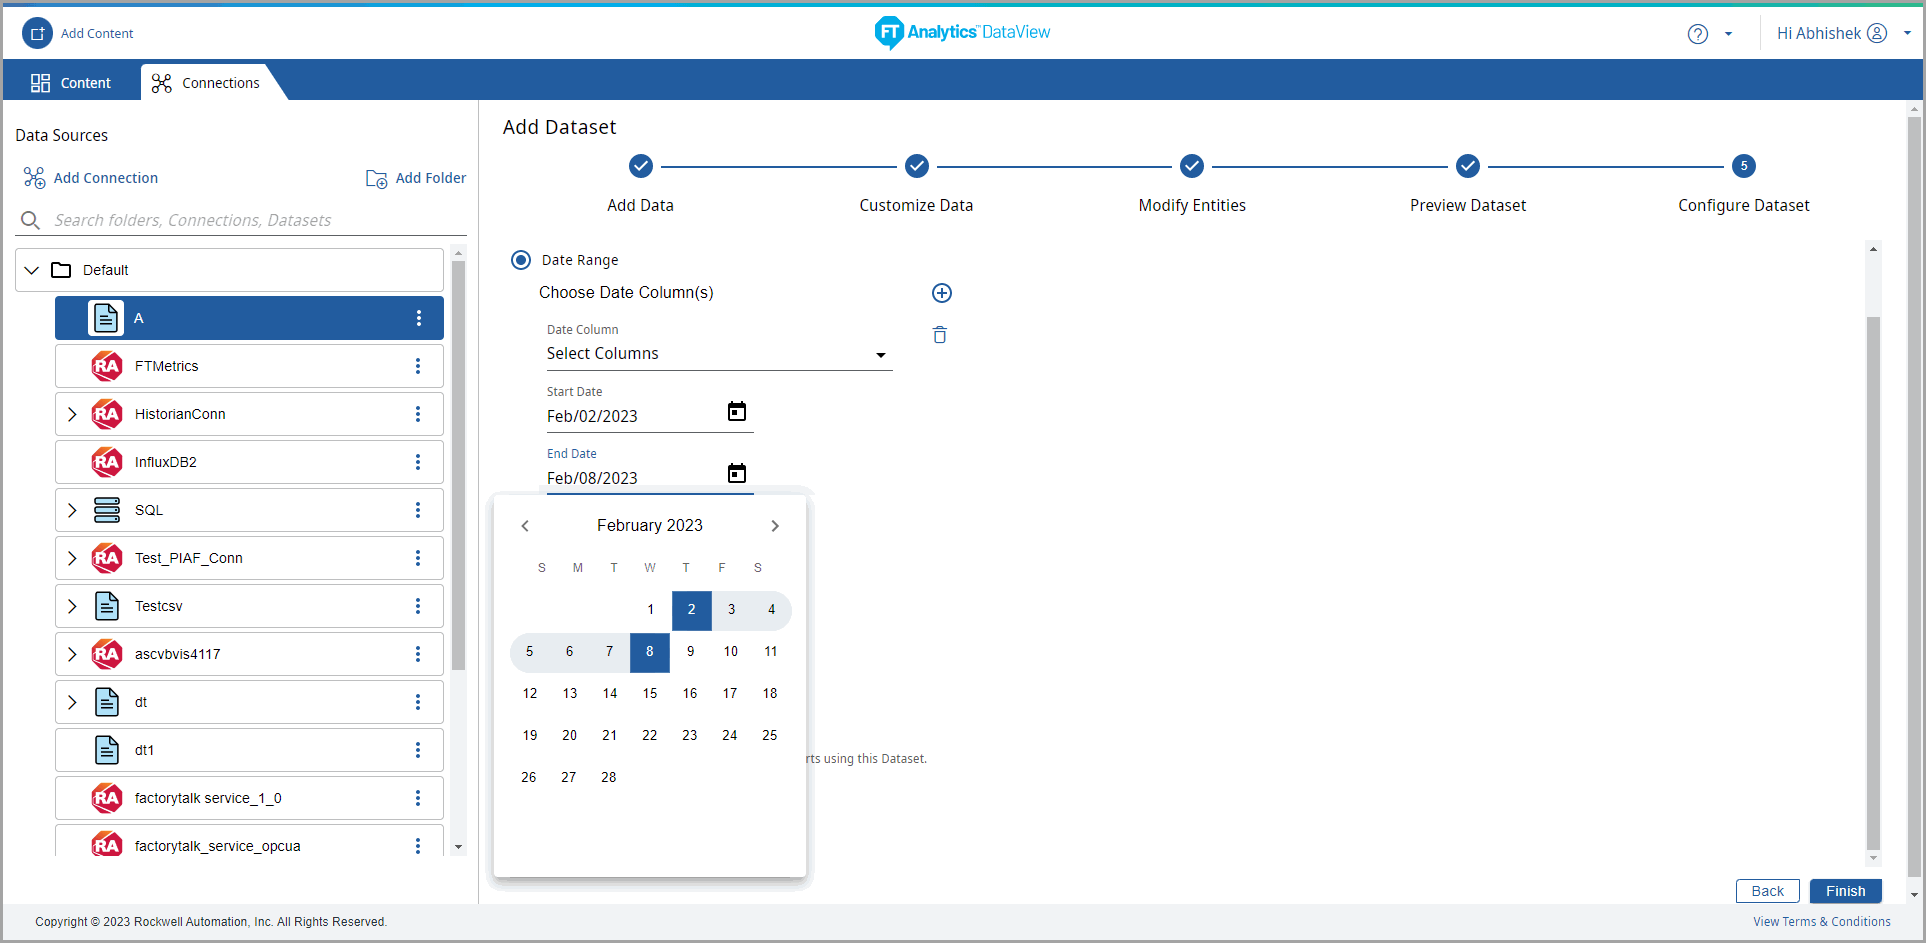
(OR) - Date Range: Select the Date column and the date range.
- Click in the Date field to select the Start Date and End Date from the calendar. User can select the Start Date and End date from the calendar (OR) type the date in Date field in Mmm/dd/yyyy format (e.g. Sep/14/2022).NOTE:The calendar date picker icon is disabled here while configuring the Data Sync with Date Range.Configure Data Sync - Date Range
(OR) - Numeric Range: Select the numerical column and the numeric range.Configure Data Sync - Numeric Range
 NOTE:For any time zone, system will sync the data from the last date available in Elasticsearch. Due to any error if the DataSource has the future timestamp, data sync will not happen.
 - Data Sync Schedule: Select the following:
- Default: 30 minutes
- Custom: Time interval to sync dataNOTE:The minimum custom time interval is 5 seconds.
- Custom Cron Expression: Enables the Users to setup the data synchronization schedule based on the User defined time. For more information on the Custom Cron Expression, refer to Custom Cron Expression.
- Specify the valid Cron expression and click [Validate].
- The“Valid Cron Expression”success message displays.
- Default Display Count
- From the drop-down list (100, 1000, 10000, or All Available) select the default number of records to display for Charts using this Dataset. By default, 100 records is selected.NOTE:Tested till 99999999 number of records to display on Charts.
Select Default Display Count
- Shards And Replicas Configuration
- Provide the required number of shards and replicas.
NOTE:The default number of shards are one and the replicas are zero. The number of shards and replicas are editable only before saving the Storyboard.NOTE:In a single node, Elasticsearch can save maximum 1000 Shards. In cluster node, Elasticsearch can save maximum 2000 Shards. Increase the cluster capacity to save more Shards.Configure Data Sync Schedule
- Click [Finish] the“Dataset Saved Successfully” message displays and Create a Storyboard for this Dataset dialog displays.NOTE:The Dataset and the folders created are arranged in ASCII order.Save Dataset

- If user does not want to continue creating the Content, click [Not Now]. This saves the dataset.(OR)Click [Sure] to continue creating the Content. The Add Content page displays.
- Dataset informationClick the new Dataset, navigate through the tabs to view respective information:
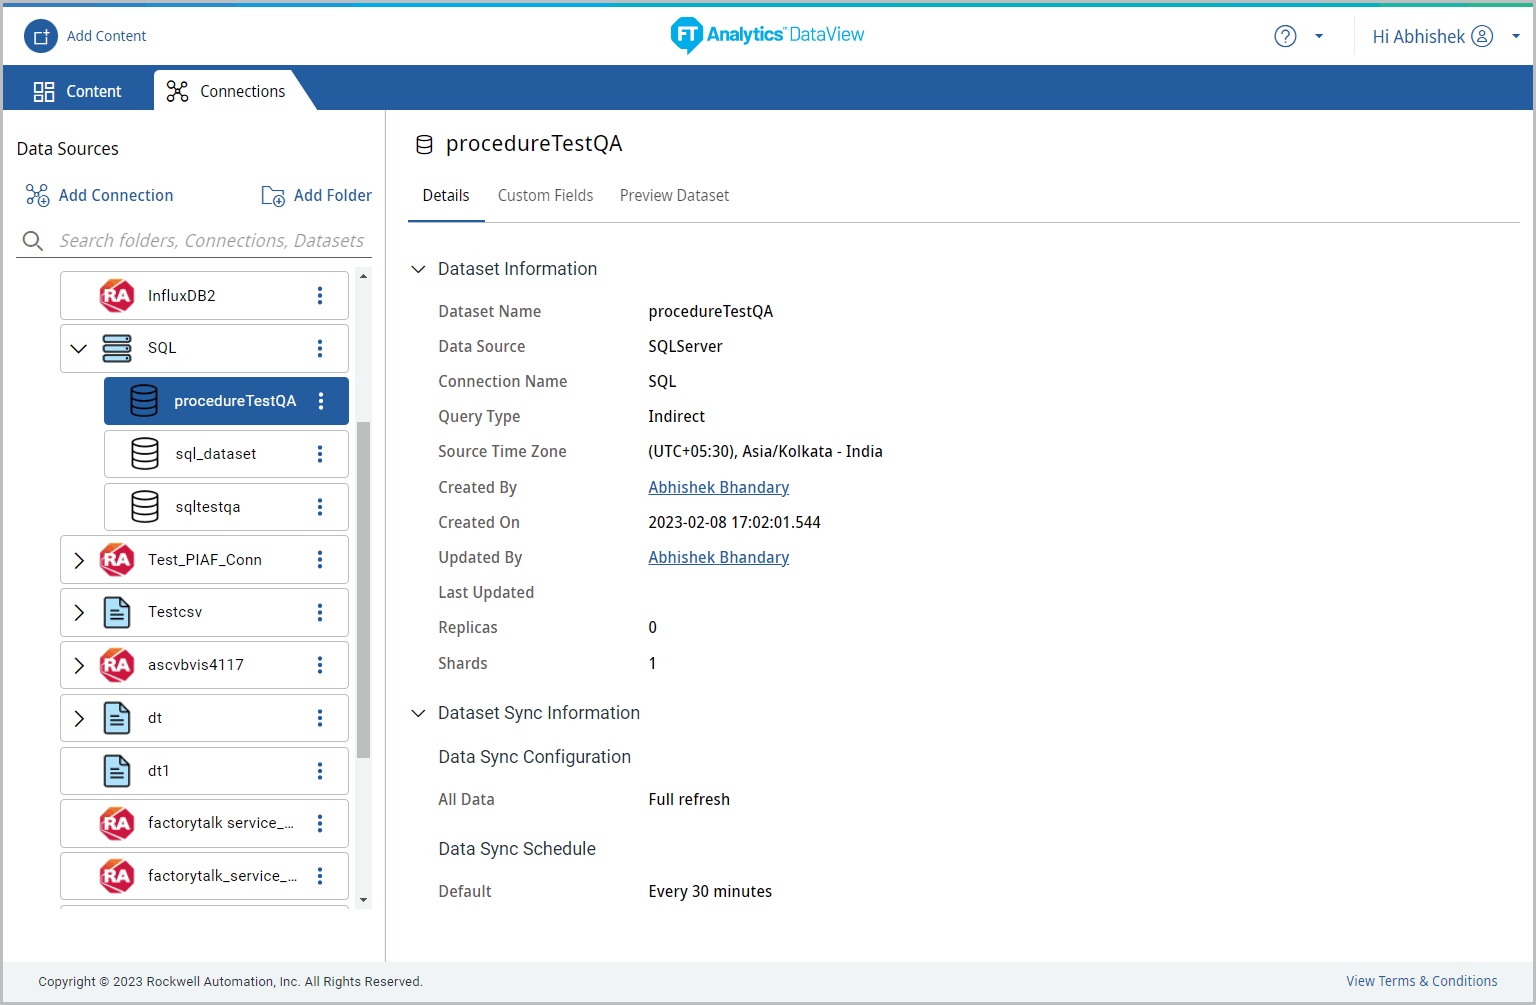
- Details tab: Displays the Dataset created information and Dataset Sync information.
- The following details are displayed for the dataset created with Indirect query:
- Dataset Sync Information: Dataset Name, Data Source, Connection Name, Query Type, Source Time Zone, Created By, Created On, Updated By, Last Updated, Replicas, and Shards.
- Dataset Sync Information: Data Sync Configuration and Data Sync Schedule.Dataset Information
- Preview Dataset: Displays the Dataset preview for 1000 rows by default. User can select the number of rows to display from the drop-down list. Click the column header to apply filter to the columns or to select the columns to display on the Preview Dataset panel.NOTE:If Custom Field is created the column is displayed on the Preview Dataset page.Preview Dataset
- Custom Fields: Displays the created Custom fields for the dataset created with indirect Query only.
- Click [Add Custom Field] to create a new custom field.Custom Field

- The Custom Fields dialog displays. Provide the following details:
- Provide the Custom Field name.
- Define the formula in the Add Formula editor box. User can create the Custom Field in dataset with Numeric or String or Date type data.NOTE:User can paste the formula in the Add Formula Editor box.Add Custom Field

- Refer to Custom Field for detailed steps to create Custom Field.Custom Field - Created

- After creating the Custom Field the column is added to the dataset and displays on the Preview Dataset page, filters, Quick Access menu. The user can use it on all chart settings configurations like X-Y axis, reference line, legend series or tooltip. User can share and embed the Content created with a dataset, and the same custom field is available to the shared user and the embedded Content.Custom Field - Created

Provide Feedback