Monitor
This section helps in monitoring the information about performance and the health of the running DataView server, search engine, DataImporter, and the database associated with DataView.
- Click [Monitor] in the toolbar to view the health status.NOTE:The Monitor page displays the status of single connected node, while working with multi node cluster.
The component health status is indicated in three colors:
- GREEN:Good, the component is up and running.
- RED:Down and not working.
- YELLOW:Elasticsearch shards are not yet recovered.NOTE:YELLOW indicates only for the Elasticsearch component. By default, the Elasticsearch health status will be green if the default number of shards and replicas are used. When user changes the number of shards and replicas are updated, the Elasticsearch status will turn to YELLOW.Monitor Page
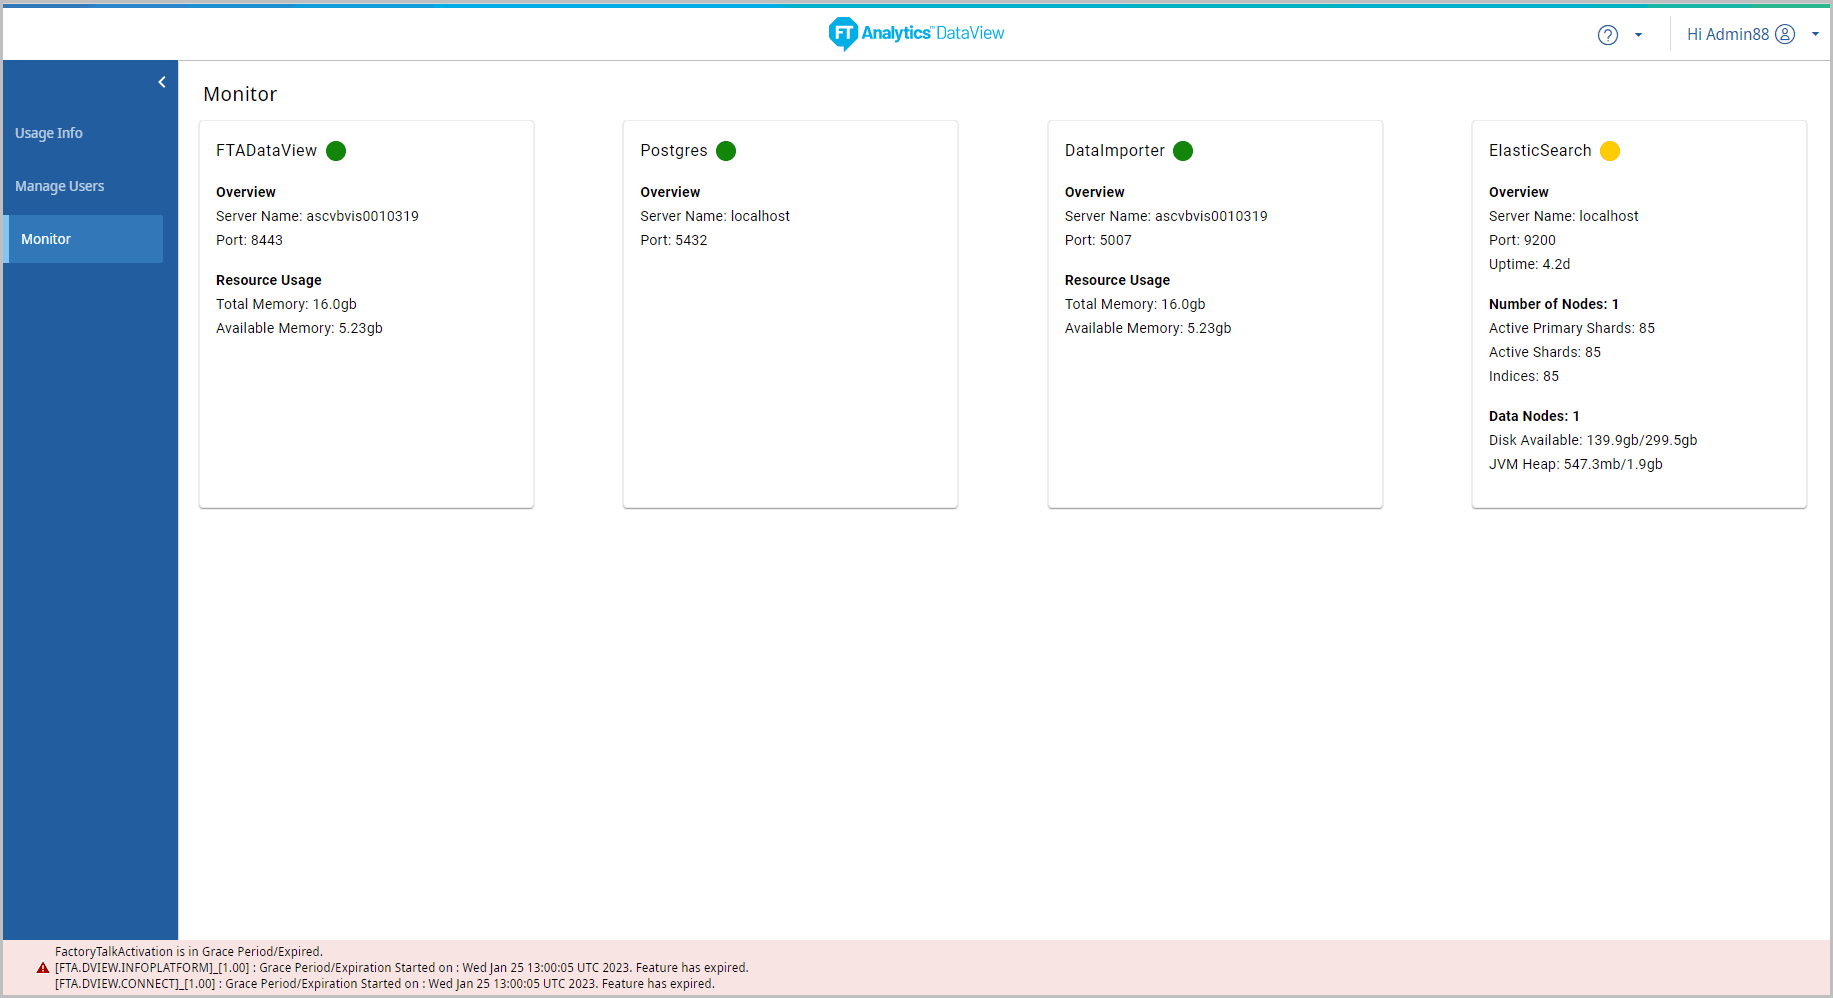
The Monitor page displays the health of the following:
FTADataView:
Displays the following details of the FTADataView server:
- Health status:
- Color: GREEN/RED
- Overview:
- Server Name
- Port
- Resource Usage:
- Total Memory
- Available Memory
Postgres:
- Health status:
- Color: GREEN/RED
- Overview:
- Server Name
- Port
DataImporter
- Health status:
- Color: GREEN/RED
- Overview:
- Server Name
- Port
- Resource Usage:
- Total Memory
- Available Memory
Elasticsearch:
Displays the following details of the Elasticsearch:
- Health status:
- Color: GREEN/RED/YELLOW
- Overview:
- Server Name
- Port
- Uptime
- Number of Nodes:
- Active Primary Shards
- Active Shards
- IndicesNOTE:For a storyboard generated with indirect query, the Indices will be split into 1 Shards and 0 Replica. The default number of Shards are one and the Replicas are zero. The number of shards and replicas are editable only before saving the Storyboard.
- Data Nodes:
- Disk Available
- JVM HeapNOTE:To enable Elasticsearch instance leverage full advantage of system's memory, it is recommended to extend the Heap Size up to half the memory (50% or less) available on the system RAM. User (dv admin) can manually set the heap size in configuration file. If heap size is not properly set, other problems may be encountered besides memory errors. Refer to Configure Elasticsearch Java Virtual Machine (JVM) chapter for detailed steps.
Provide Feedback