Trending
Perform the following steps in the trend chart:
- Click the [
 ] icon from the menu bar.
 - Click [Add Sensor/KPI].
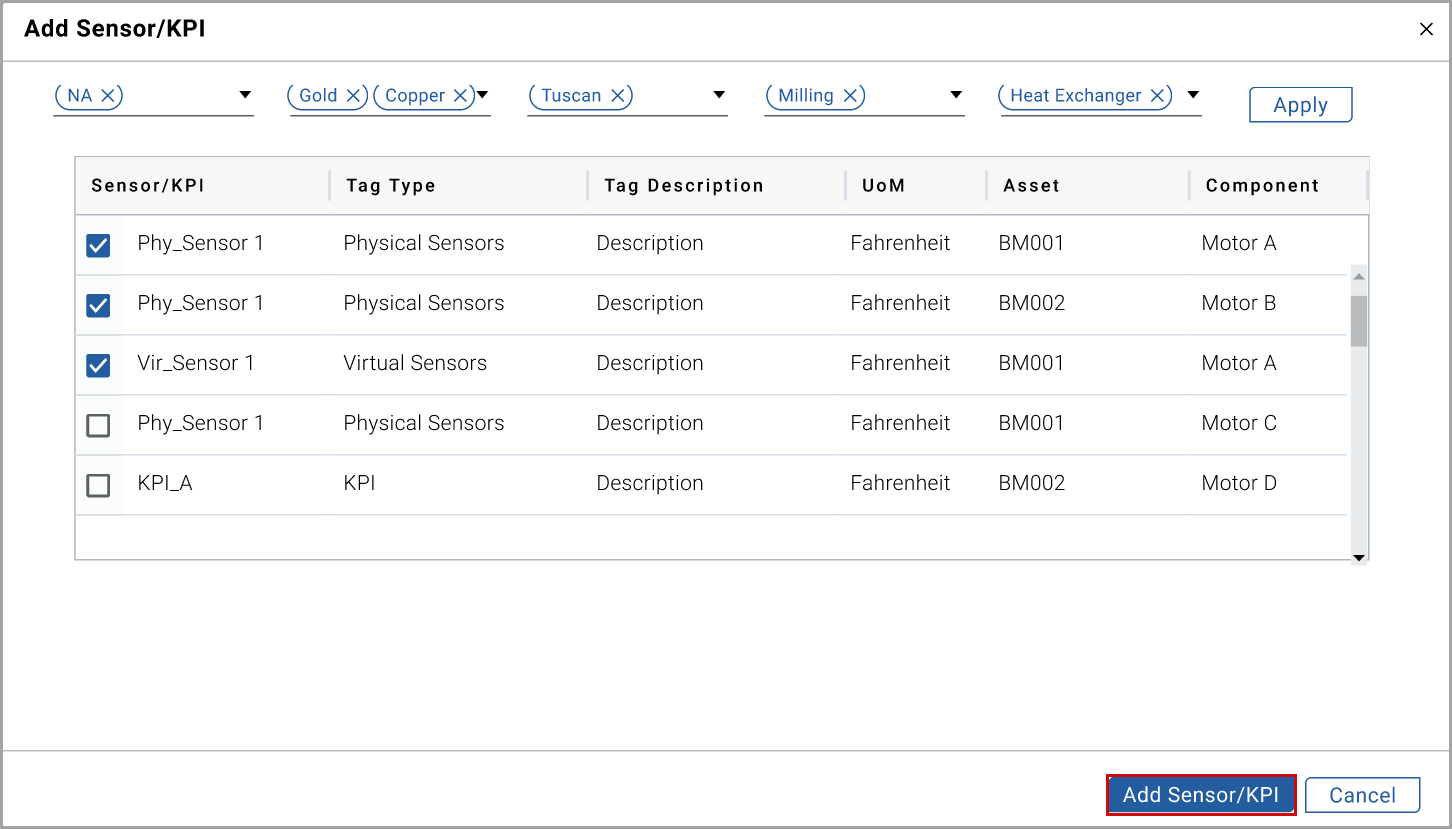
- In theAdd Sensor/KPIwindow, set these parameters:
- Region: Select the region from the drop-down list.
- Product: Select the product from the drop-down list.
- Site: Select the site from the drop-down list.
- Area: Select the area from the drop-down list.
- Asset Class: Select the asset class from the drop-down list.
- Click [Apply].
- From the table, select the required sensors or KPI check box and click [Add Sensor/KPI].Add Sensor/KPI window
 You can view the trend chart of selected sensors and KPIs. By default, the trend chart is shown for the past month. If you hover over any line in the chart, it shows the date, time, and KPI value.Trend chart
 NOTE: Click on the chart legendary to hide the particular sensor/KPI line from the chart.You can also view theTrend Summarytable. In this table, you can view the selected KPI/Sensor details, tag type and description, min, max, and average value on the selected time period, Unit of Measurement (UoM), and asset and component details.NOTE: Click the [x] icon from the available sensors or KPI at the top of the trending page then that particular sensor or KPI will be removed from the table and the chart.Trend summary table
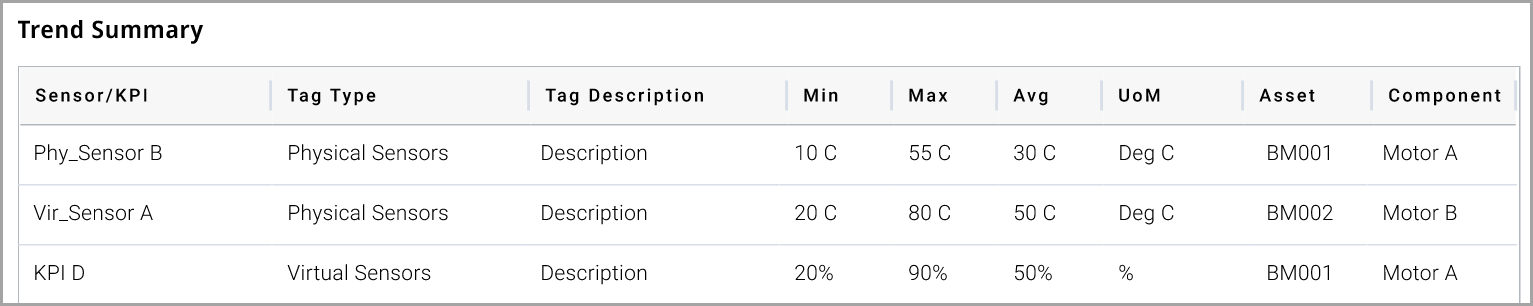
Provide Feedback