Sensor Fault Alerts
Sensor Faults are used to detect if there are issues with the data that is coming into the application. They are used at both asset and component levels.
There are a few key definitions that are needed to understand Sensor Faults:
- Invalid data
- Data that exceeds the Lower or Upper Sensor Fault Limit.
- Data that is repeated, at least 15 points in a row or more.
- Analyzed over the last X days, typically X is 30 days.
- Valid data
- Data that is valid and can be used within the application.
- Calculated formula: Valid Data [%] = 100% - Invalid Data % – Data Break %.
- Data Break
- Data Breaks are where there is no data available.
- Data of the type Not a Number (NaN).
- Sensor Fault can be raised for three reasons:
- Upper Limit Exceeded – Sensor Raw value exceeds Upper Sensor Fault Limit
- Lower Limit Exceeded – Sensor Raw value exceeds Lower Sensor Fault Limit
- High Invalid Data – More than 30% Invalid Data
There are two different tabs available in Sensor Fault Alerts:
- Overview
- Trends
Sensor Fault Overview

Overview
TabIn the
Overview
tab, there are three different sections: Fault Details, Sensor Fault Action, and Work Order.In the
Fault Details
, you can view the alert details such as Sensor Fault ID, Description, Status, Trigger date, Sensor Name and Description, and Asset/Component Association. You additionally have a breakdown of the Valid and Invalid Data calculations, with definitions as provided aboveIn the
Sensor Fault Action
section, with appropriate user privileges, you have the ability to change the status of the Sensor Fault Alert Status, Add Comments, and Upload associated files. For Sensor Fault Alert Status, here is the definition of each status:
- Open
- In-Progress
- Closed
In the
Work Order
section, it allows for the manual tracking of the associated Work Order required to action the alert.- Work Order No: Provide the work order number for the alert.
- Work Order Status: Select the status from the drop-down list.
- Comments: (Optional) Provide the comments for the alert as required.
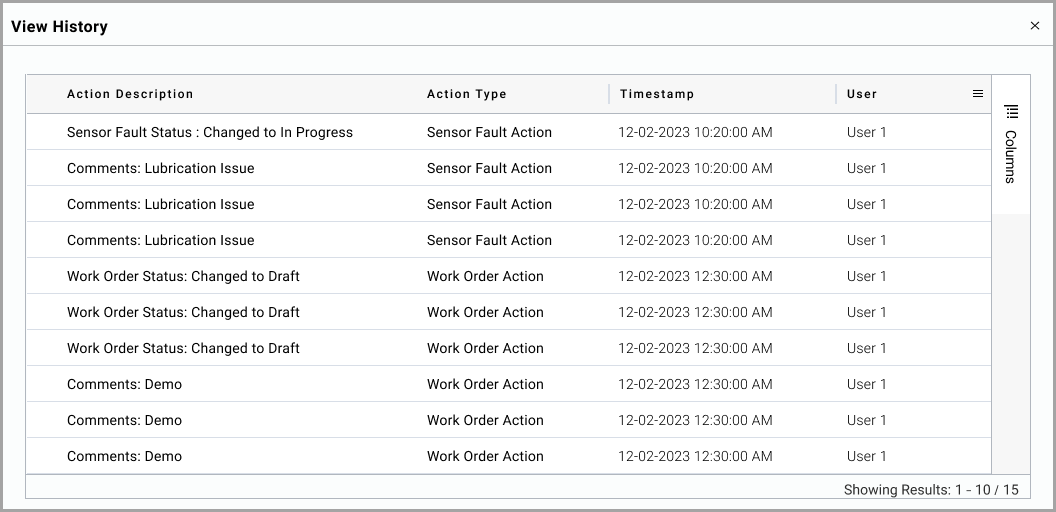
NOTE:
To view the history of changes that happened in the Sensor Fault Action and Work Order section, click [View History].
View History
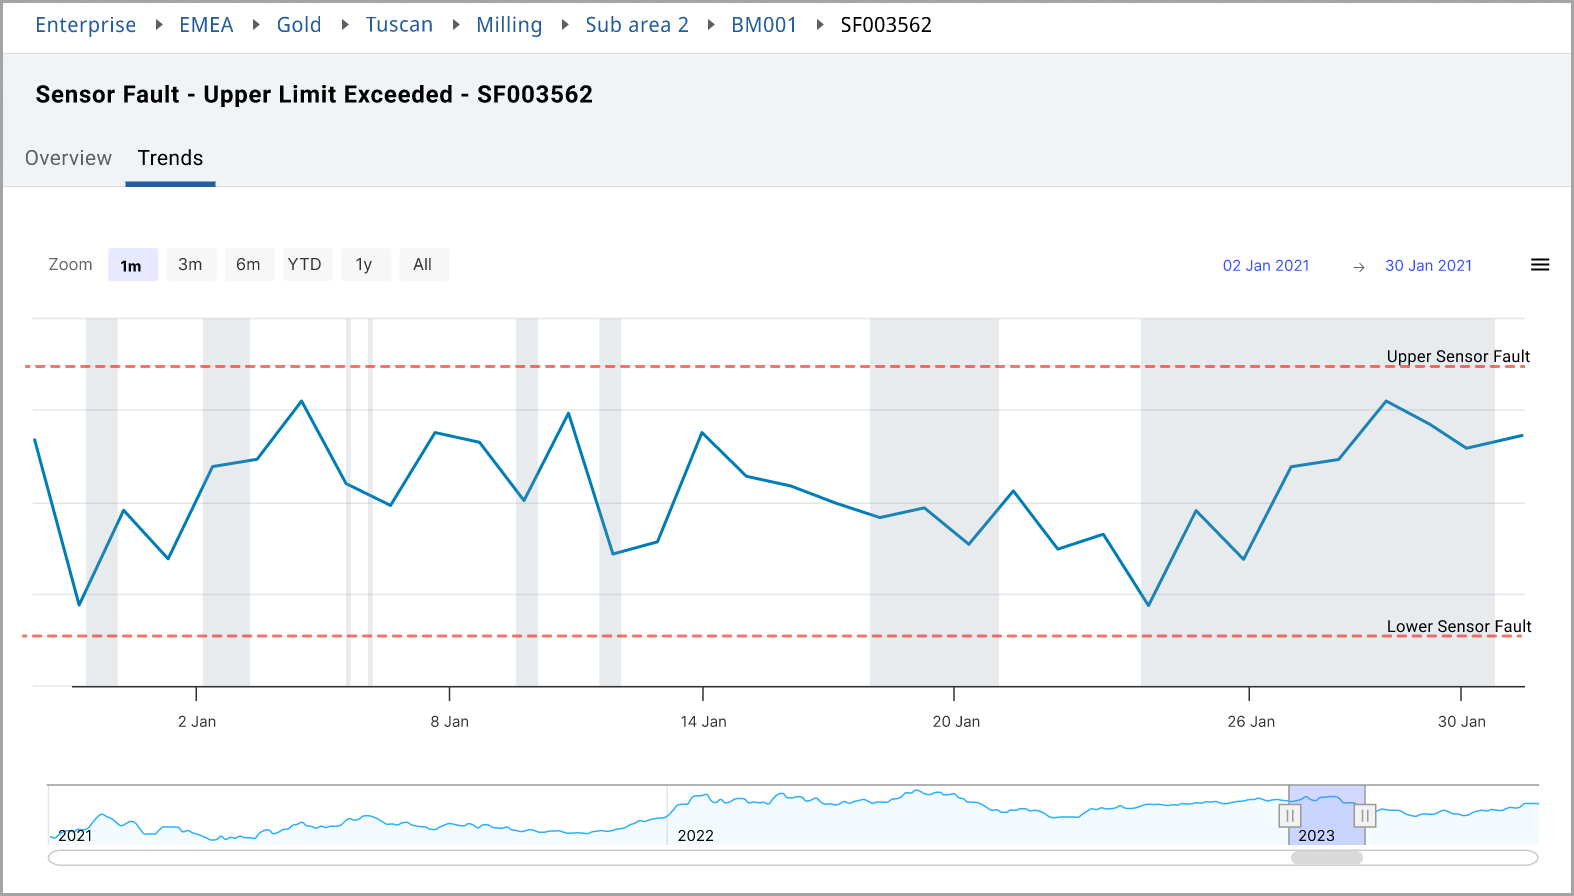
In the Trend, you can view both the Trend at the top and a sparkline view at the bottom. You can change the date selection by using the selectors of 1/3/6 months, year to date [YTD], 1 year, and all. You can use the sliding selector at the bottom to change the date selection.
The red horizontal lines indicate the configured Sensor Fault Alert Thresholds Upper Sensor Fault and Lower Sensor Fault. Vertical grey bars indicate thresholds exceeded areas.
Sensor Fault Trend Tab
Provide Feedback