KPI Alerts
The KPI alerts are used to detect when a KPI threshold is breached, notify the user through the application. The KPI's are configured at both the asset and component levels. There are two different tabs available in the KPI alerts:
- Overview
- Trends
KPI Alert Overview
In the
Overview
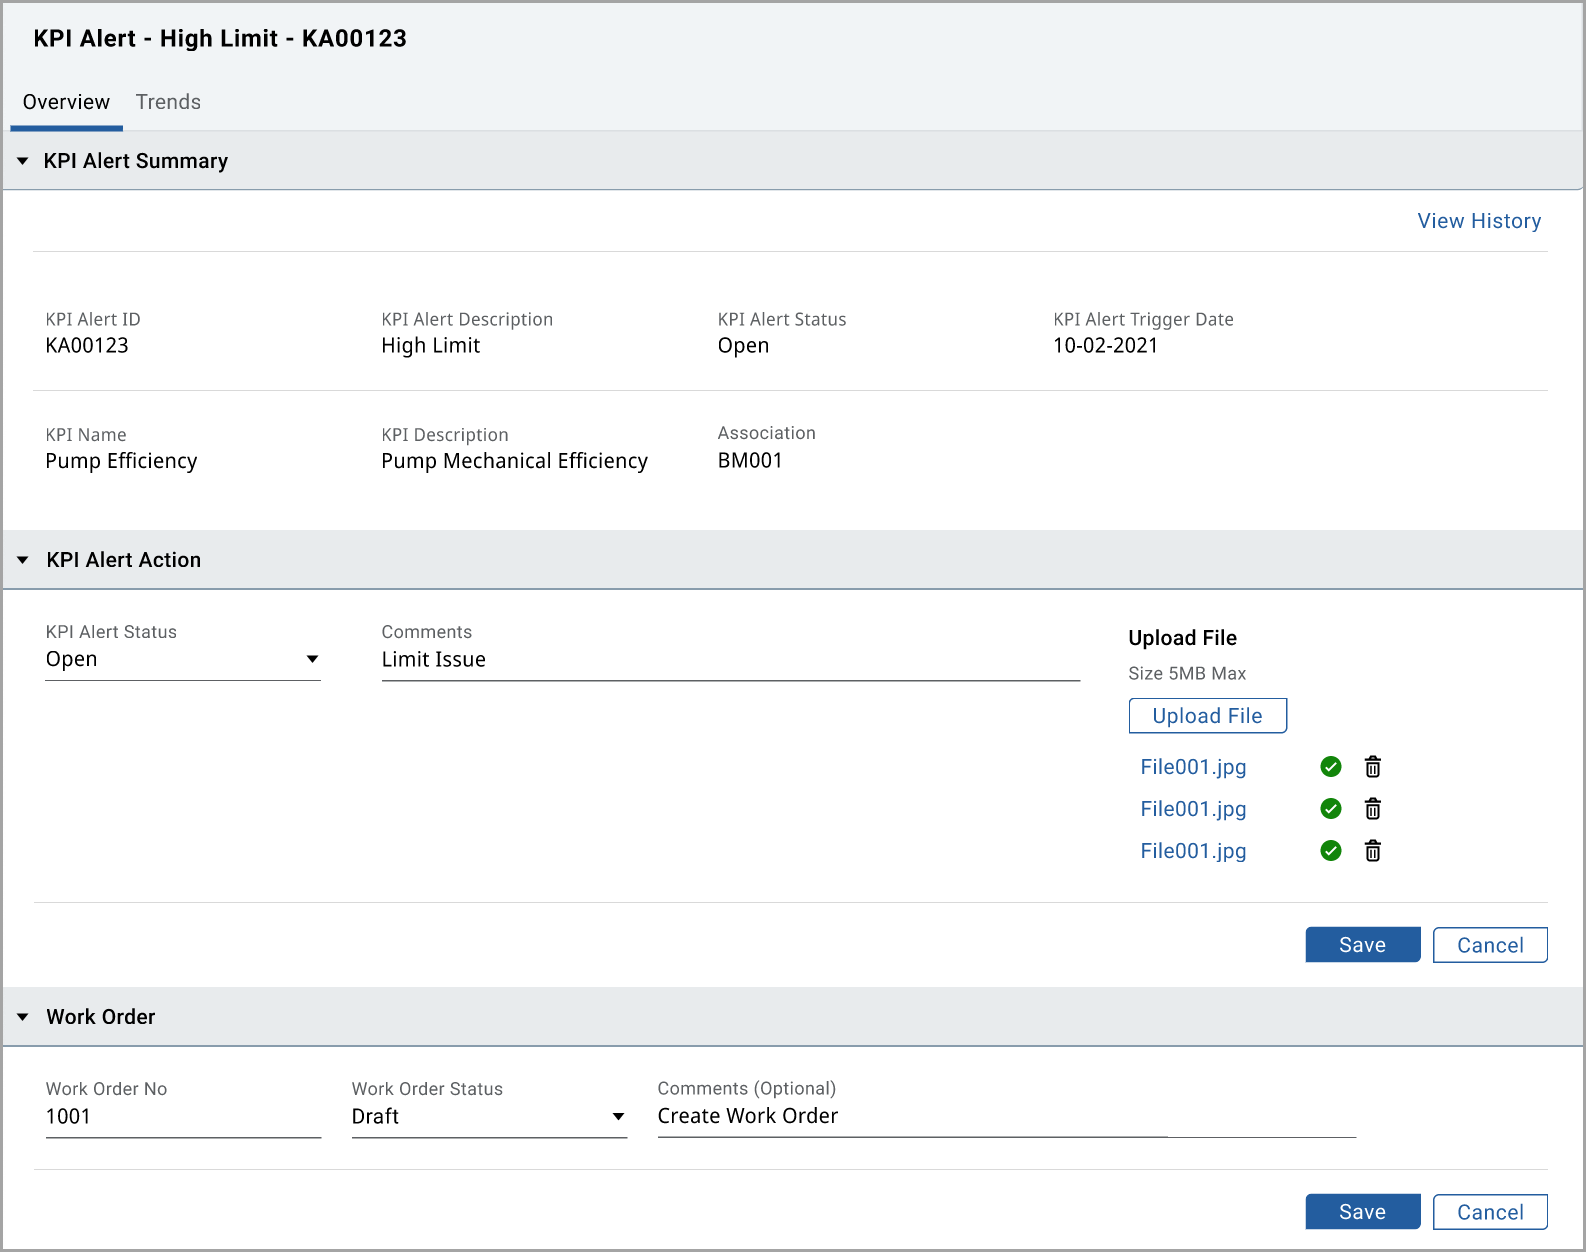
tab, there are three different sections such as KPI Alert Summary, KPI Alert Action, and Work Order. In the
KPI Alert Summary
, you can view the details of the alert such as alert ID, description, status, trigger date, KPI name and description, and association. In the
KPI Alert Action
, with appropriate user privileges, you have the ability to change the status of the KPI Alert Status, Add Comments, and Upload associated files.For KPI Alert Status, here is the definition of each status:
- Open:
- In-Progress:
- Closed:
In the Work Order section, it allows for the manual tracking of the associated Work Order required for action the alert.
- Work Order No: Provide the work order number for the alert.
- Work Order Status: Select the status from the drop-down list.
- Comments: (Optional) Provide the comments for the alert as required.
NOTE:
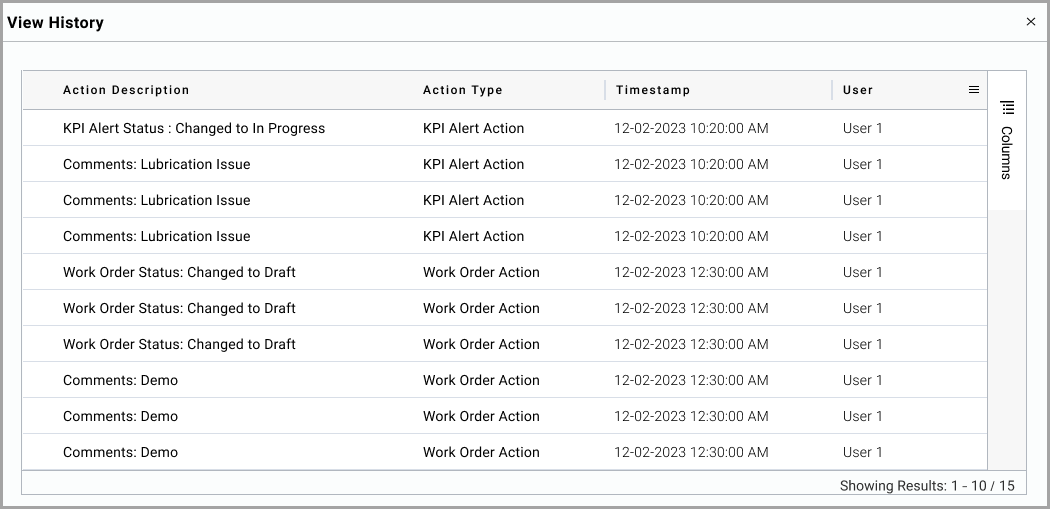
To view the history of changes that happened in the KPI Alert Action and Work Order section, click [View History]
View History
In the Trend, you can view both the Trend at the top and a sparkline view at the bottom. You can change the date selection by using the selectors of 1/3/6 months, year to date [YTD], 1 year, and all. You can use the sliding selector at the bottom to change the date selection.
The red horizontal lines indicate the configured KPI Alert thresholds of Low, Medium, and High, both the Upper and Lower thresholds for each. The following table provides additional information on the thresholds and the abbreviations used in the graphic.
Alert Severity | Alert Lower Limits | Alert Higher Limits |
|---|---|---|
Low | LAL | LAU |
Medium | MAL | MAU |
High | HAL | HAU |
The vertical dotted line shows today's value, the trend after today indicates the forecast KPI, and the trend before today shows the historical data. Vertical grey bars indicate the thresholds exceeded areas.
KPI Alert Trend Tab

Provide Feedback