Component Level Dashboard
In this dashboard, you can view the overview of the Asset's component. Based on the component configuration, Advisories, KPIs, and Sensors will populate accordingly.
Select the required Component from the hierarchy list and you can see the following tabs in the dashboard:
- Advisory
- KPIs
- Sensors
- Info
Advisory
tab:The Advisory tab is used to display the predictive elements of the component. You have three elements in the advisory tab: KPIs, Trends, and Advisory History.
In the
KPI
section, you can view the values of the predictive elements of the component. The following are the three different predictive elements:Predictive Elements | Definitions |
|---|---|
Current and future risk score | score is an indicator of the health of a component or an asset. It is calculated based on the degradation of the parameters, be it sensors or PLCs. The degree of parameter degradation is determined using three limits (low, medium, high) defined on either side of the normal range for a parameter. The risk score is first calculated for each parameter and then consolidated at the component level based on the weighting factors of parameters, and finally rolled up to the asset level based on the weighting factors of components. The weighting factors are derived from the Failure Mode Effect Analysis for that asset/asset class. The risk score is a time-dependent quantity because the parameter values vary with time. The current risk score is calculated based on the latest available parameter data and the Future risk score is calculated based on the forecasted parameter data. The forecast period is considered as 3 weeks by default. |
Remaining useful hours | As the degradation of the parameters proceeds, the risk score approaches maximum leading to failure. The Remaining Useful Life calculation relies on the future risk score values. It is defined as the duration from the current/latest time point till the point when the future risk score becomes 100%. If the future risk score does not reach 100% within the default 3-week forecast period, RUL is stated as greater than 504h (3x7x24h). The RUL is reported both at the component and asset levels. The minimum of the RUL values of all components is considered as Asset RUL. |
In the
Trends
section, you can view the component predictive KPIs over time, these are current and future risk score, and remaining useful life.Advisory Summary

In
Advisory History
, you can view the history of advisory alerts. Click on any Advisory ID to view further details in the Advisory Alerts.Advisory History

If there is no predictive element configured to the component, you will see the following screen and it shows “
No predictive failure model available for this component
”.No Predictive element configured to the component

KPIs
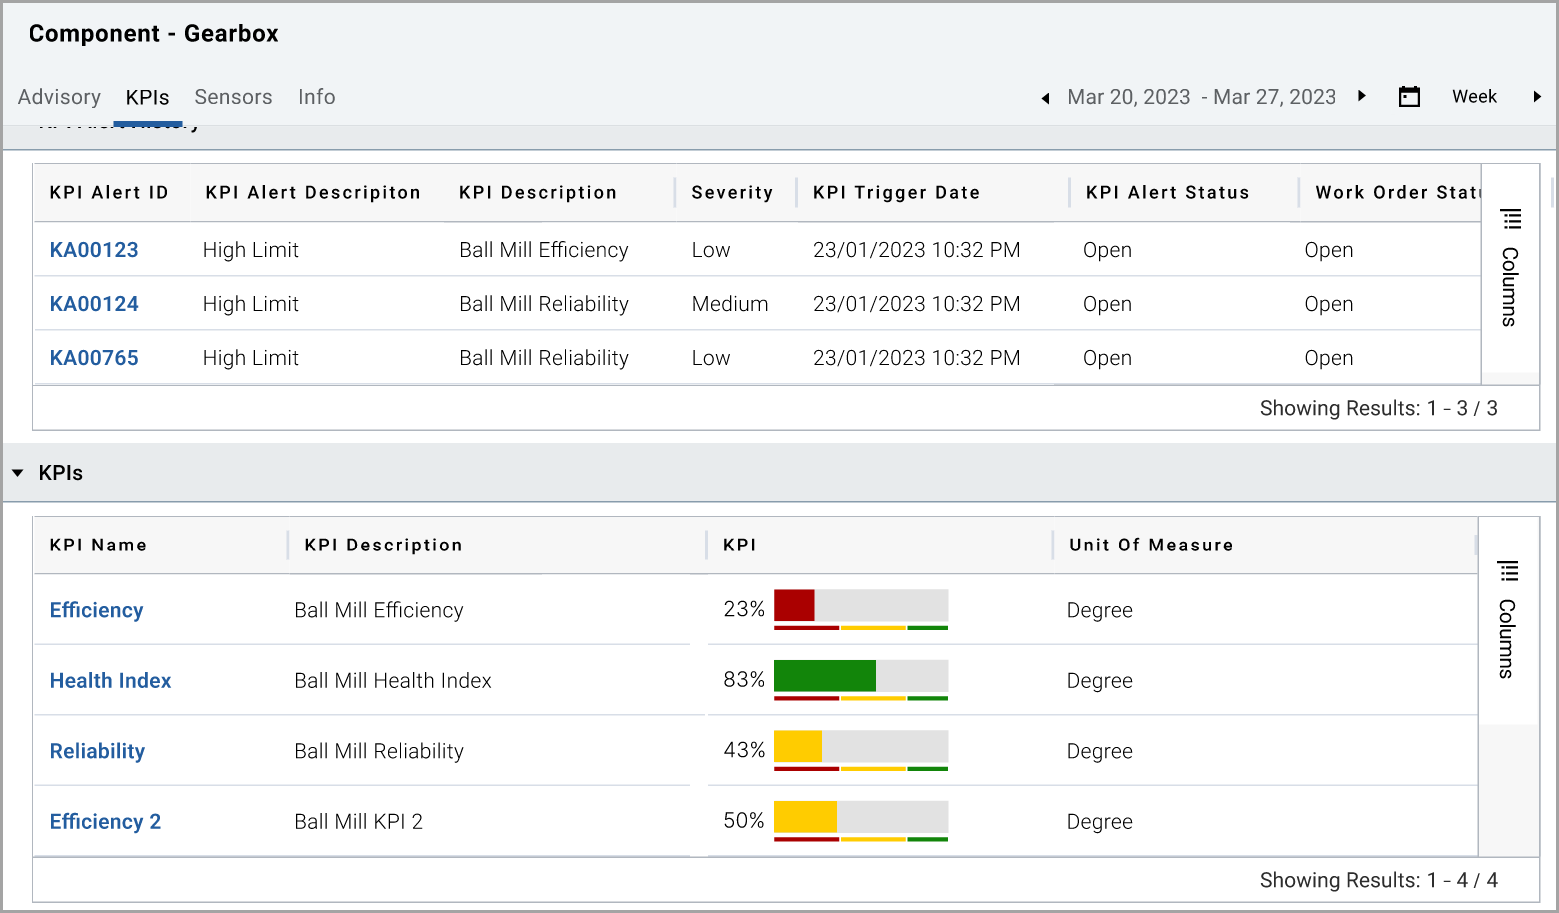
tabYou can view KPI Alert history for the applicable time period, and the configured KPIs to the Asset for the applicable time period. The KPI alert history shows all KPI alerts. Click on any KPI Alert ID to view more details in the KPI Alerts.
KPI alert summary

NOTE:
You can use the [ ] in the respective column to filter based on your needs
Click on any
KPI
, for example, Efficiency to view the graphic below to show you how the KPI has been performing over time, against the configured limits. For more details, see the Configuration
section.KPI Trend

In the Trend, you can view both the Trend at the top and a sparkline view at the bottom. You can change the date selection by using the selectors of 1/3/6 months, year to date [YTD], 1 year, and all. You can also use the sliding selector at the bottom.
The red horizontal lines indicate the configured KPI Alert thresholds of Low, Medium, and High, both the Upper and Lower thresholds for each. The following table provides additional information on the thresholds and the abbreviations used in the graphic.
Alert Severity | Alert Lower Limits | Alert Higher Limits |
|---|---|---|
Low | LAL | LAU |
Medium | MAL | MAU |
High | HAL | HAU |
The vertical dotted line shows today's value, the trend after today indicates the forecast KPI, and the trend before today shows the historical data. The vertical grey bars indicate areas, where the thresholds have been exceeded.
Sensors
tabYou can view the sensor fault history, physical sensors, and virtual sensors.
In
Sensor Fault History
, you can view all the Sensor Faults based on the selected time period. Click on the Sensor Fault ID
to view details in the sensor fault alerts. In
Physical Sensors
, you can view the sensors list with description, Data availability%, Valid data %, Unit of measure, Association, and Past 30 days' trend. In
Virtual Sensors
, you can view the sensors list with description, Unit of measure, Association, and Past 30 days' trend.Sensors Summary tab

Virtual Sensors

Click on any
Sensor name
from the Physical and Virtual Sensors section to view the additional details of sensor trend.Physical Sensor Trend

Virtual Sensor Trend

In the Trend, you can view both the Trend at the top and a sparkline view at the bottom. You can change the date selection by using the selectors of 1/3/6 months, year to date [YTD], 1 year, and all. You can use the sliding selector at the bottom to change the date selection.
The red horizontal lines indicate the configured Sensor Fault Alert, Thresholds Upper Sensor Fault, and Lower Sensor Fault. Vertical grey bars indicate thresholds exceeded areas.
Info
tabYou can view the general and system information about the Component.
Component Info

Provide Feedback
