Area Level Dashboard
In this dashboard, you can view the overview of the Area. Based on the configuration, the respective KPI details are displayed in the
Overview
tab in the form of cards.Select the appropriate site from the hierarchy list and you can see the following tabs in the dashboard:
- Overview
- Areas
- Assets
Overview
tab:You can view the status of the site. You can view the configured KPIs across the application under the selected site and the top five underperforming assets on the selected time frame. You can also view the active alerts with severity, actions taken, and the current status of the alert.
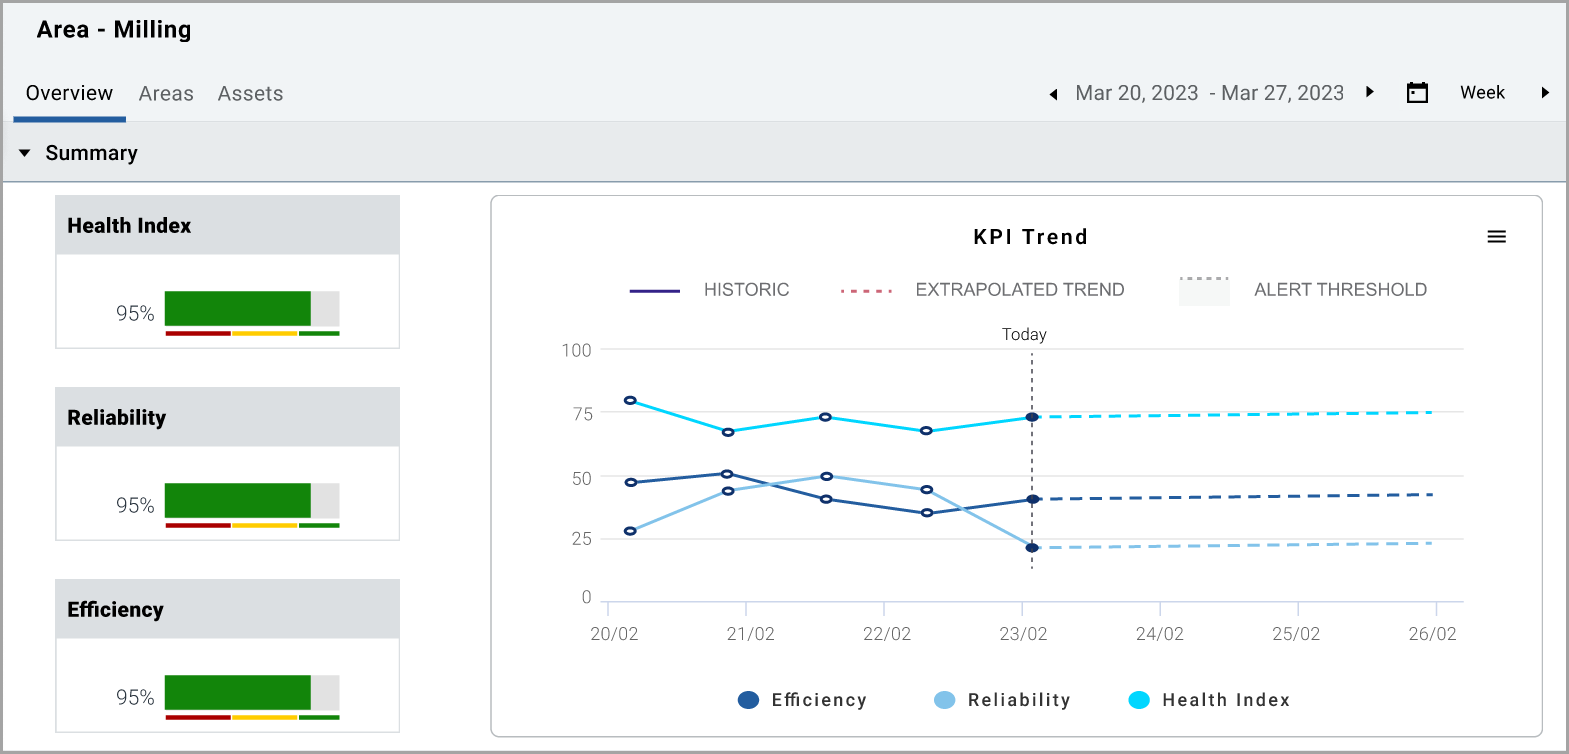
Summary chart
NOTE:
Click the [>], [>>], [<], [<<] paginator icons in the summary graph to move forward and backward to view the data.
In the KPI trend chart, three lines indicate the three different KPI data, the solid lines indicate the historical data, and the dotted line indicates the extrapolated future projected data.
When you click over the dotted line, you can see the red color dotted line that indicates the alert threshold line.
Threshold chart

You can view the individual KPI graph of the top 5 underperforming assets and the graph is shown for the past 3 months.
Top 5 underperforming chart

NOTE:
You can use the [ ] in the respective column to filter based on your needs.
Click the [ ] icon on the left side of the respective asset name to view the asset hierarchy details.
Asset details

You can view all the active alerts with alert descriptions, severity, start date, action taken, and current status details.
Active alerts

To change the time period, click the [ ] icon and select the required date in the
From
and To
box.Areas
tab:You can view the status of the area on the site. Each Area, for example, Crushing has associated KPIs of Health Index, Efficiency, Reliability, Throughput, and Alert count. The associated KPIs are configured in the dashboard setup and the same KPIs are across the application.
KPI values are rolled up according to the hierarchy, with Alerts and KPI values originating in each asset and rolling up accordingly. You can also view the top five underperforming assets. All of these are based on the selected time frame selectable in the top right corner of the dashboard.
Subarea cards

Assets
tab:You can view summaries of the asset classes associated to this point in the hierarchy. Each card represents an Asset Class with rolled-up statuses. By selecting an individual Asset Class, you can filter the list of assets available in the
Asset Details
section.Asset cards

Asset Details

NOTE:
Click on any cards from the summary section to view the relevant asset class in the asset details section.
Provide Feedback