
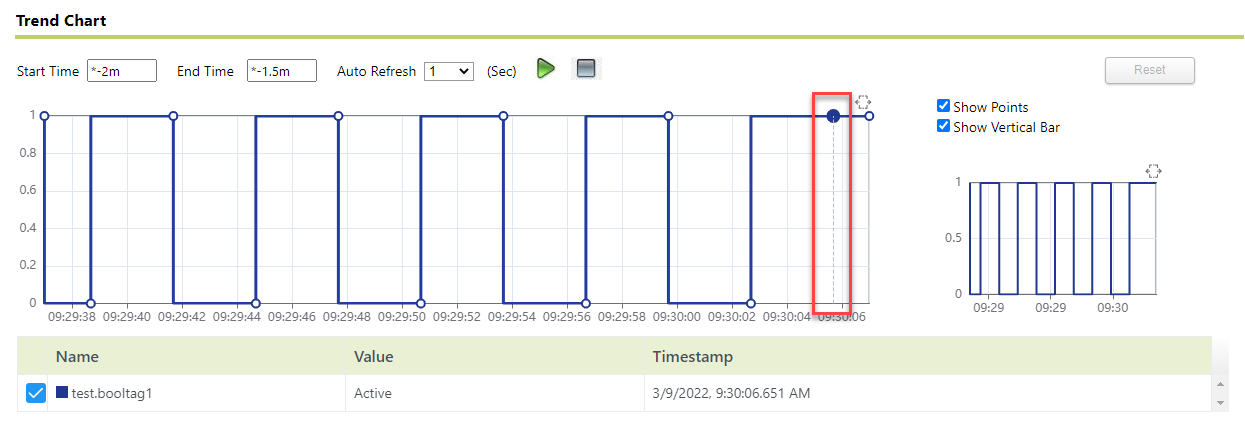
Display the vertical bar on the trend
Use the
Show Vertical Bar
option to display a vertical bar across all points on the X-axis. At the bottom of the trend, timestamps will be adjusted when you click inside the trend and drag the vertical bar across it.To display the vertical bar on the trend
- Click
 .The button color changes to grey (
 ). The data on the trend is no longer refreshed.
 - Select theShow Vertical Baroption next to the trend.When you move the mouse pointer over the trend, a vertical bar moves along with the pointer.
- Click
 .
. TIP:When Daylight Savings Time (DST) occurs, the timestamps displayed will be automatically updated to reflect the time change. If you adjust the start time to an earlier start time, the timestamps reflected will coincide with DST even if the DST transfer did not occur until later.
Provide Feedback