
Controller statistics
The
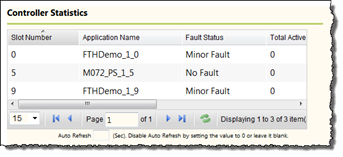
Controller Statistics
page provides the following information on Logix Controllers in the chassis:Item | Description |
|---|---|
Slot Number | The chassis slot in which the Logix Controller is installed. |
Application Name | The name of the program running on the Logix Controller. |
Fault Status | The Logix Controller’s current fault status is one of the following:
|
Collected Points | The total number of tags actively collected between the module and this controller. |
Point Event Rate/Sec | The number of tag reads from this controller, per second, accumulated over a rolling 10-second period. Therefore, the value is the average tag reads per second over the previous 10 seconds. |
Point Failure Rate/Sec | The number of tags read failures from this controller, per second, accumulated over a rolling 10-second period. Therefore, the value is the average tag read failures per second over the previous 10 seconds. |
CPU Loading | The controller's CPU utilization in tenths of a percent. For example, the range
of 0 - 100 represents 0% to 100%. |
Provide Feedback