XY plots
A trend chart can either plot values against time or against a selected pen. In an XY Plot, the x-axis represents the value of a selected pen.
The time span controls the number of points displayed. For example, if the time span is 20 seconds and the interval is 1 second, the chart displays up to 20 points. Data points outside the time span are removed from the display. The time span is included in the chart title.
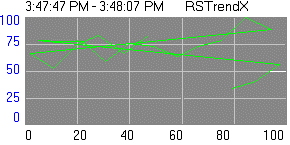
In the example chart, the x-axis pen is read from the N7:21 address in a PLC. The green pen represents values read from N7:22. The chart shows:
- the last value was read at 3:48:07 (represented by the time span in the chart title)
- at that time, the value in N7:21 was almost 80
- the value in N7:22 was between 25 and 50
Provide Feedback