TimeSpan property
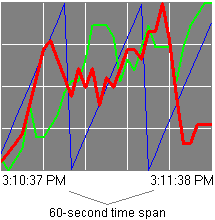
Returns or sets the length of time (in seconds) represented by the visible area of the chart. Read/write. Long.
Syntax
xaxis.
TimeSpan
[ = value
]where
xaxis
- is an XAxis object, or an expression that evaluates to an XAxis object.value
- is a parameter of the type long that specifies the number of seconds displayed.Remarks
A trend chart can either plot values against time or against a selected pen. In a standard line chart, each pen is plotted against time.
- Set up the chart style on the Trend properties General tab.
The end time in the illustration is 61 seconds past the start, because the time labels include the first and last seconds.
When edited using the Properties page, the Time Span is limited to 32767 of the selected units. When set through the object model, this limit does not apply, and any positive long integer number of seconds may be used.
If the start time and the time span add up to a time past 12/31/37 (December 31, 2037) the time span will be modified so that the end time is 12/31/37.
Provide Feedback