DisplayTime property
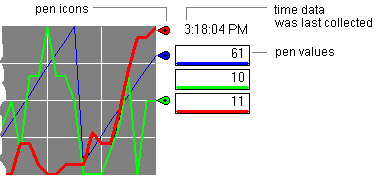
Returns or sets whether the time when data was last collected is displayed above the pen values in the current value legend on the right side of the chart. Read/write. Boolean.
This property has no effect unless the DisplayPenValues property is True.
Chart example
- Set up the current value legend options on the Trend properties Display tab.
Syntax
Trend
.DisplayTime
[ = state
]where
Trend
- is the name of a Trend object (such as trend1), or an expression that evaluates to a Trend object.state
- is a parameter of the type Boolean that can be set to one of the following:- True. Display the time when data was last collected
- False. Do not display the time
Provide Feedback