Example: Standard line chart
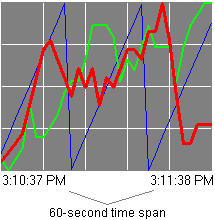
A trend chart can plot values against time, or against a selected pen. In a standard line chart, each pen is plotted against time.
Set up the chart style on the
General
tab in the Trend Properties
dialog box.Provide Feedback