Search
FactoryTalk View SE Help
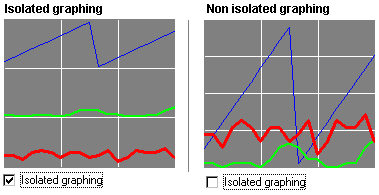
Example: Isolated graphing
Plot each pen in a separate band of a trend chart.
Select isolated, or non-isolated graphing on the
Y-Axis
tab in the Trend
Properties
dialog box.
Using Trend objects
Provide Feedback
Have questions or feedback about this documentation? Please
submit your feedback here
.
Normal