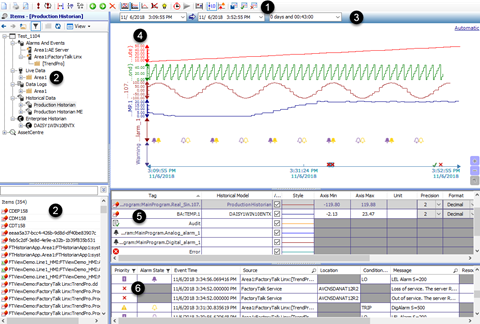
TrendPro interface
The following illustration shows an example of the TrendPro interface.
Item | Name | Description |
|---|---|---|
 | Toolbar | Displays the commonly used commands such as Live Mode  , , Automatic Scales  , , Trace Highlighting  and so on. and so on. |
 | Tag Explorer | Displays the hierarchy of folders in a tree view that represents the areas and tag folders of these data sources:
When you select a folder, its tags are listed in an alphabetically sortable list on the Double-click a tag to add it to the chart. Items pane at the bottom.At runtime, you can also drag and drop one or multiple tags to the chart. |
 | Time Bar | Provides options to select a time period using absolute or relative time.When using absolute time, select specific dates and times for the start and end of the time period. When using relative time, select a typical time period, such as the last 5 minutes or last week. |
 | Chart | Displays data from one or more tags, also known as traces, over a period of time. |
 | Trace List | Displays the list of traces that are currently on the chart. |
 | Event List | Displays the list of operator actions and alarm events that have occurred within the current trend time period. Note : Some events may not be visible on the chart because they are drawn behind higher priority events. |
Provide Feedback