Share the y-axis
When you have two or more traces on the plot surface and two or more time periods, traces for other time periods display as dimmed in the background of the plot surface. If you select this option, the trace for the current time period and the same trace that is dimmed will share the same y-axis.
TIP:
This feature is only visible when you have two or more traces and time periods on the plot surface.
One of the easiest ways to understand this feature is to stack the y-axis. For example, if you have a Sine trace and a Ramp trace, with relative time periods of 5 minutes and 10 minutes. With the 5 minute time period selected, and the y-axis not shared, the trend looks like the following:
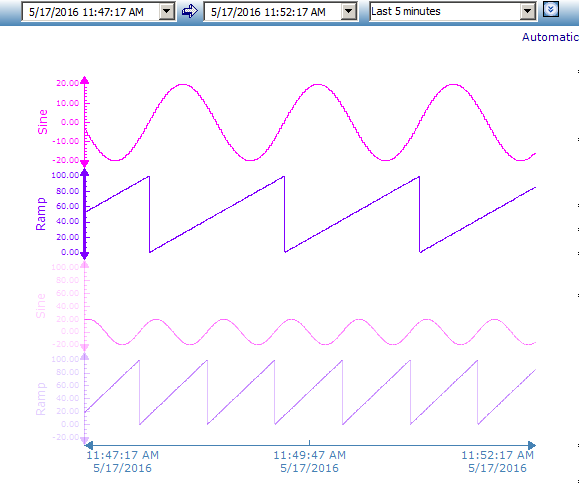
In the previous image, the Sine and Ramp traces for the 5 minute time period display on the top of the plot surface, and a dimmed version of the Sine and Ramp traces for the 10 minute time period, which doesn't have focus, display at the bottom of the plot surface.
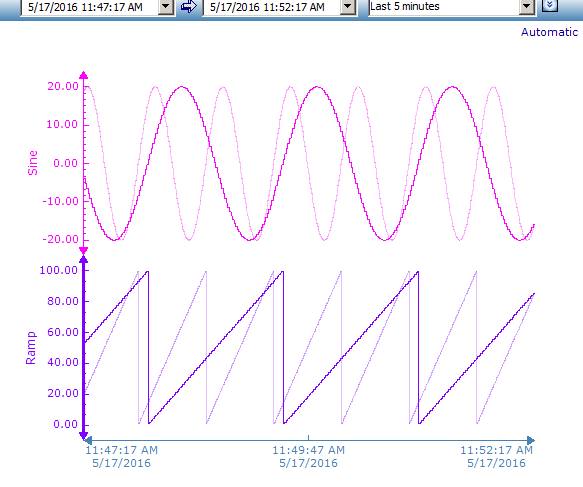
If the y-axis is shared, the Sine traces for both the 5 minute time period and 10 minute time period share the same y-axis, and the Ramp traces for both time periods share the same y-axis.
To share the y-axis
- Right-click the plot surface and selectTag Axes > Share. When selected, all traces in the time period will be adjusted to share the y-axis.If the y-axis is not shared:
- If you zoom in or out, only the traces for the currently selected time period will zoom.
- If you stack the y-axis, each trace for each time period will display as stacked.
- If you stack the x-axis, each time period displays side-by-side in a zone with the traces associated with that time period.
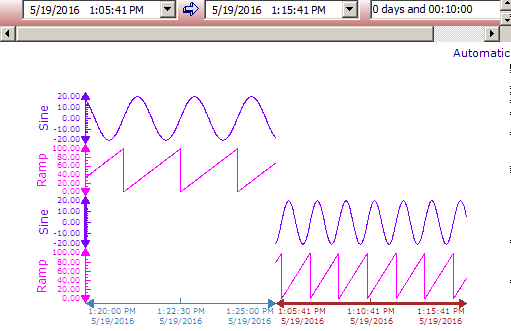
- If you stack both the y and x-axis, each trace displays on its own y-axis, and each time period displays side-by-side in a zone with the traces associated with that time period, as shown in the following example:
Provide Feedback