Monitoring Workspace
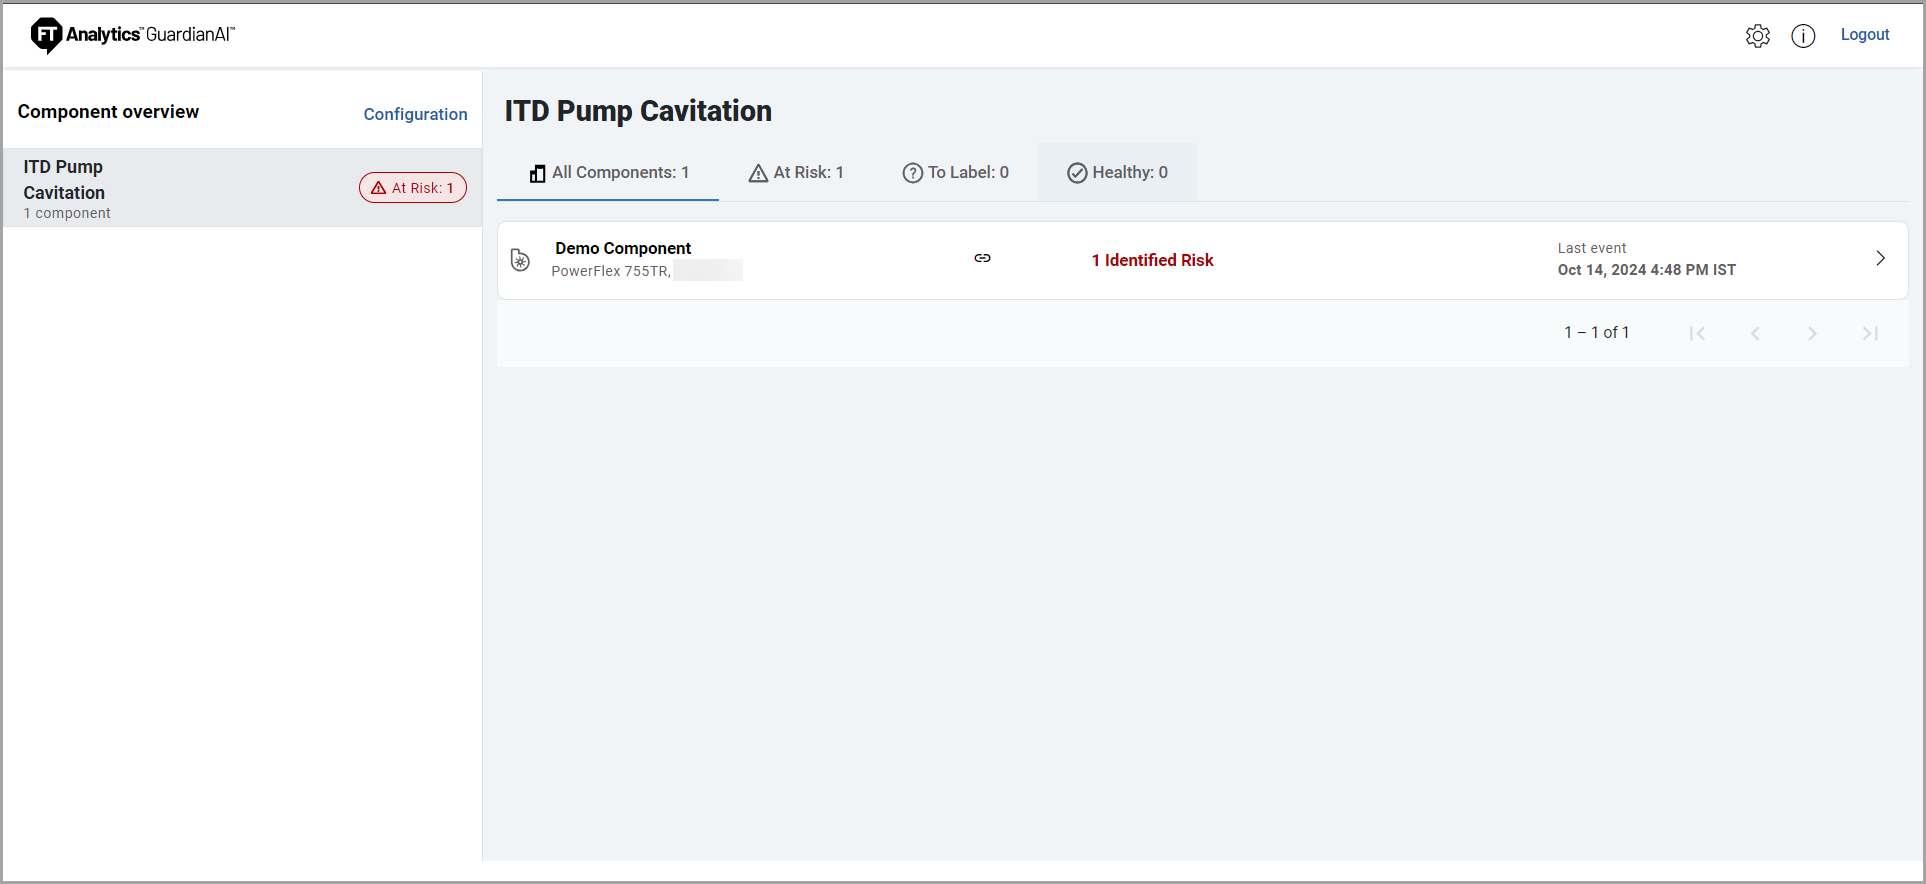
The monitoring workspace, displayed in the following figure, provides quick access to the overall status of the components monitored by FactoryTalk Analytics GuardianAI.
- The left panel displays the different folders containing the component.
- When a component in a folder encounters a deviation or failure risk, a tag on the folder illustrates the count of components encountering those events.
- The quick filters allow the user to gain additional insight into the components with a failure risk, deviation requiring labeling, or healthy components (no action required). Upon selecting a filter, only the components meeting the criteria are displayed.
- The detailed component page displays all information about the component, including a detailed view of deviations or failure risks requiring user action.
Component Monitoring Workspace
Provide Feedback