
Baseline Analyzer
The
Baseline Analyzer
tab allows the user to observe the deviations for a given time frame. It displays the Actual vs Calculated Baseline Consumption graph, Cumulated Deviation, Average Deviation, and the Baseline Formula.Baseline Analyzer

Use the date picker to select the
Observation Start Date
and
Observation End Date
.
NOTE:
The
Observation Start Date
selection starts after the
Baseline End Date
.
NOTE:
If the time zone changes, all baseline models must be recalculated. A banner message
prompts the user to recalculate the models, and the Recalculate button becomes available.
Click
Edit
and click Recalculate
for the new
changes to take effect.Recalculate
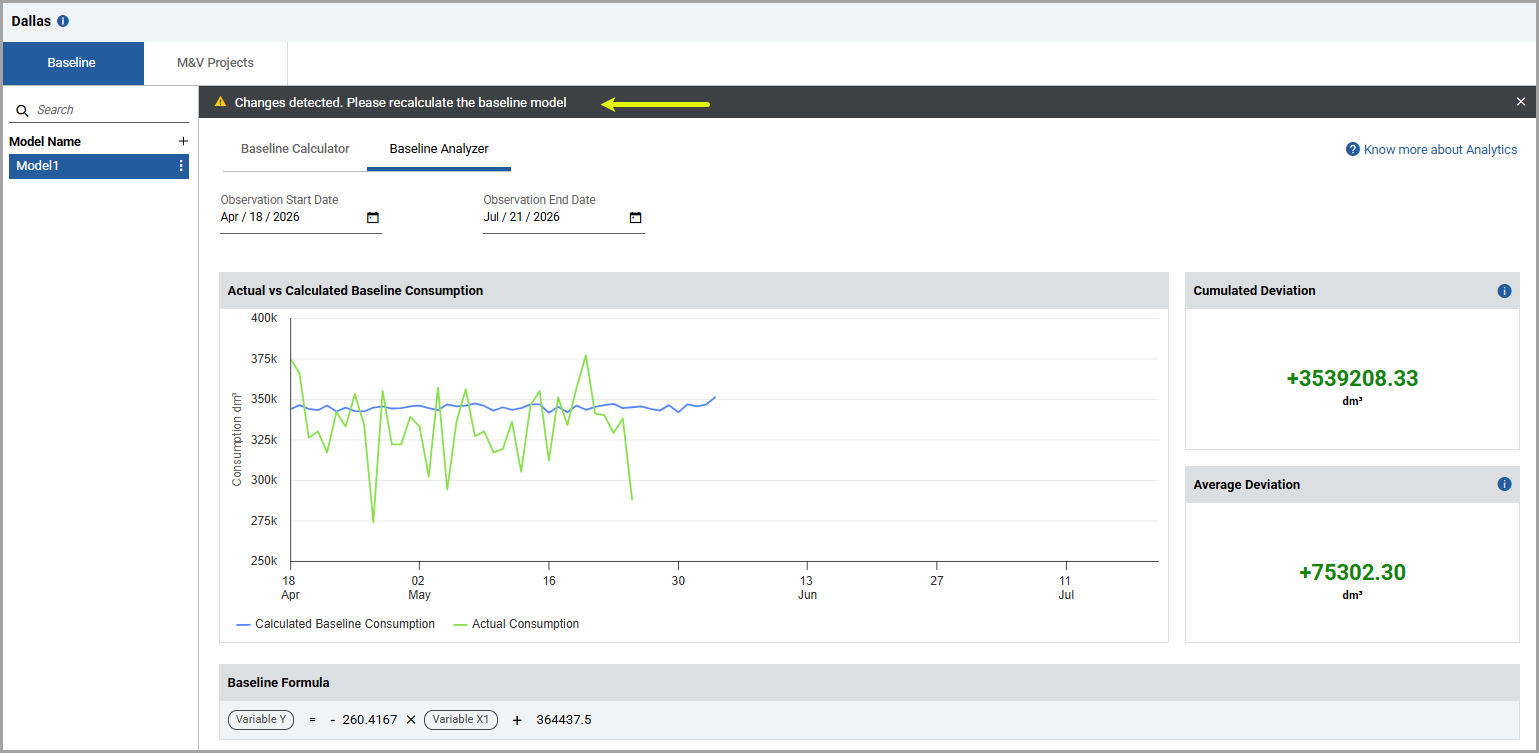
- Actual vs Calculated Baseline Consumption: This graph displays the visual representation between the Actual Baseline Consumption and Calculated Baseline Consumption.
- Cumulated Deviation: It displays the total accumulated difference between the actual measured values and the theoretical baseline values over the specified observation period.
- Average Deviation: It displays the mean difference between actual measured values and the theoretical baseline values over the specified observation period.
- Baseline Formula: The baseline formula.
Provide Feedback