Controller Webpages
The controller provides diagnostic webpages that track controller performance, network performance, and backplane performance. Controller webpages are read-only.
IMPORTANT:
Controller webpages are disabled by default .
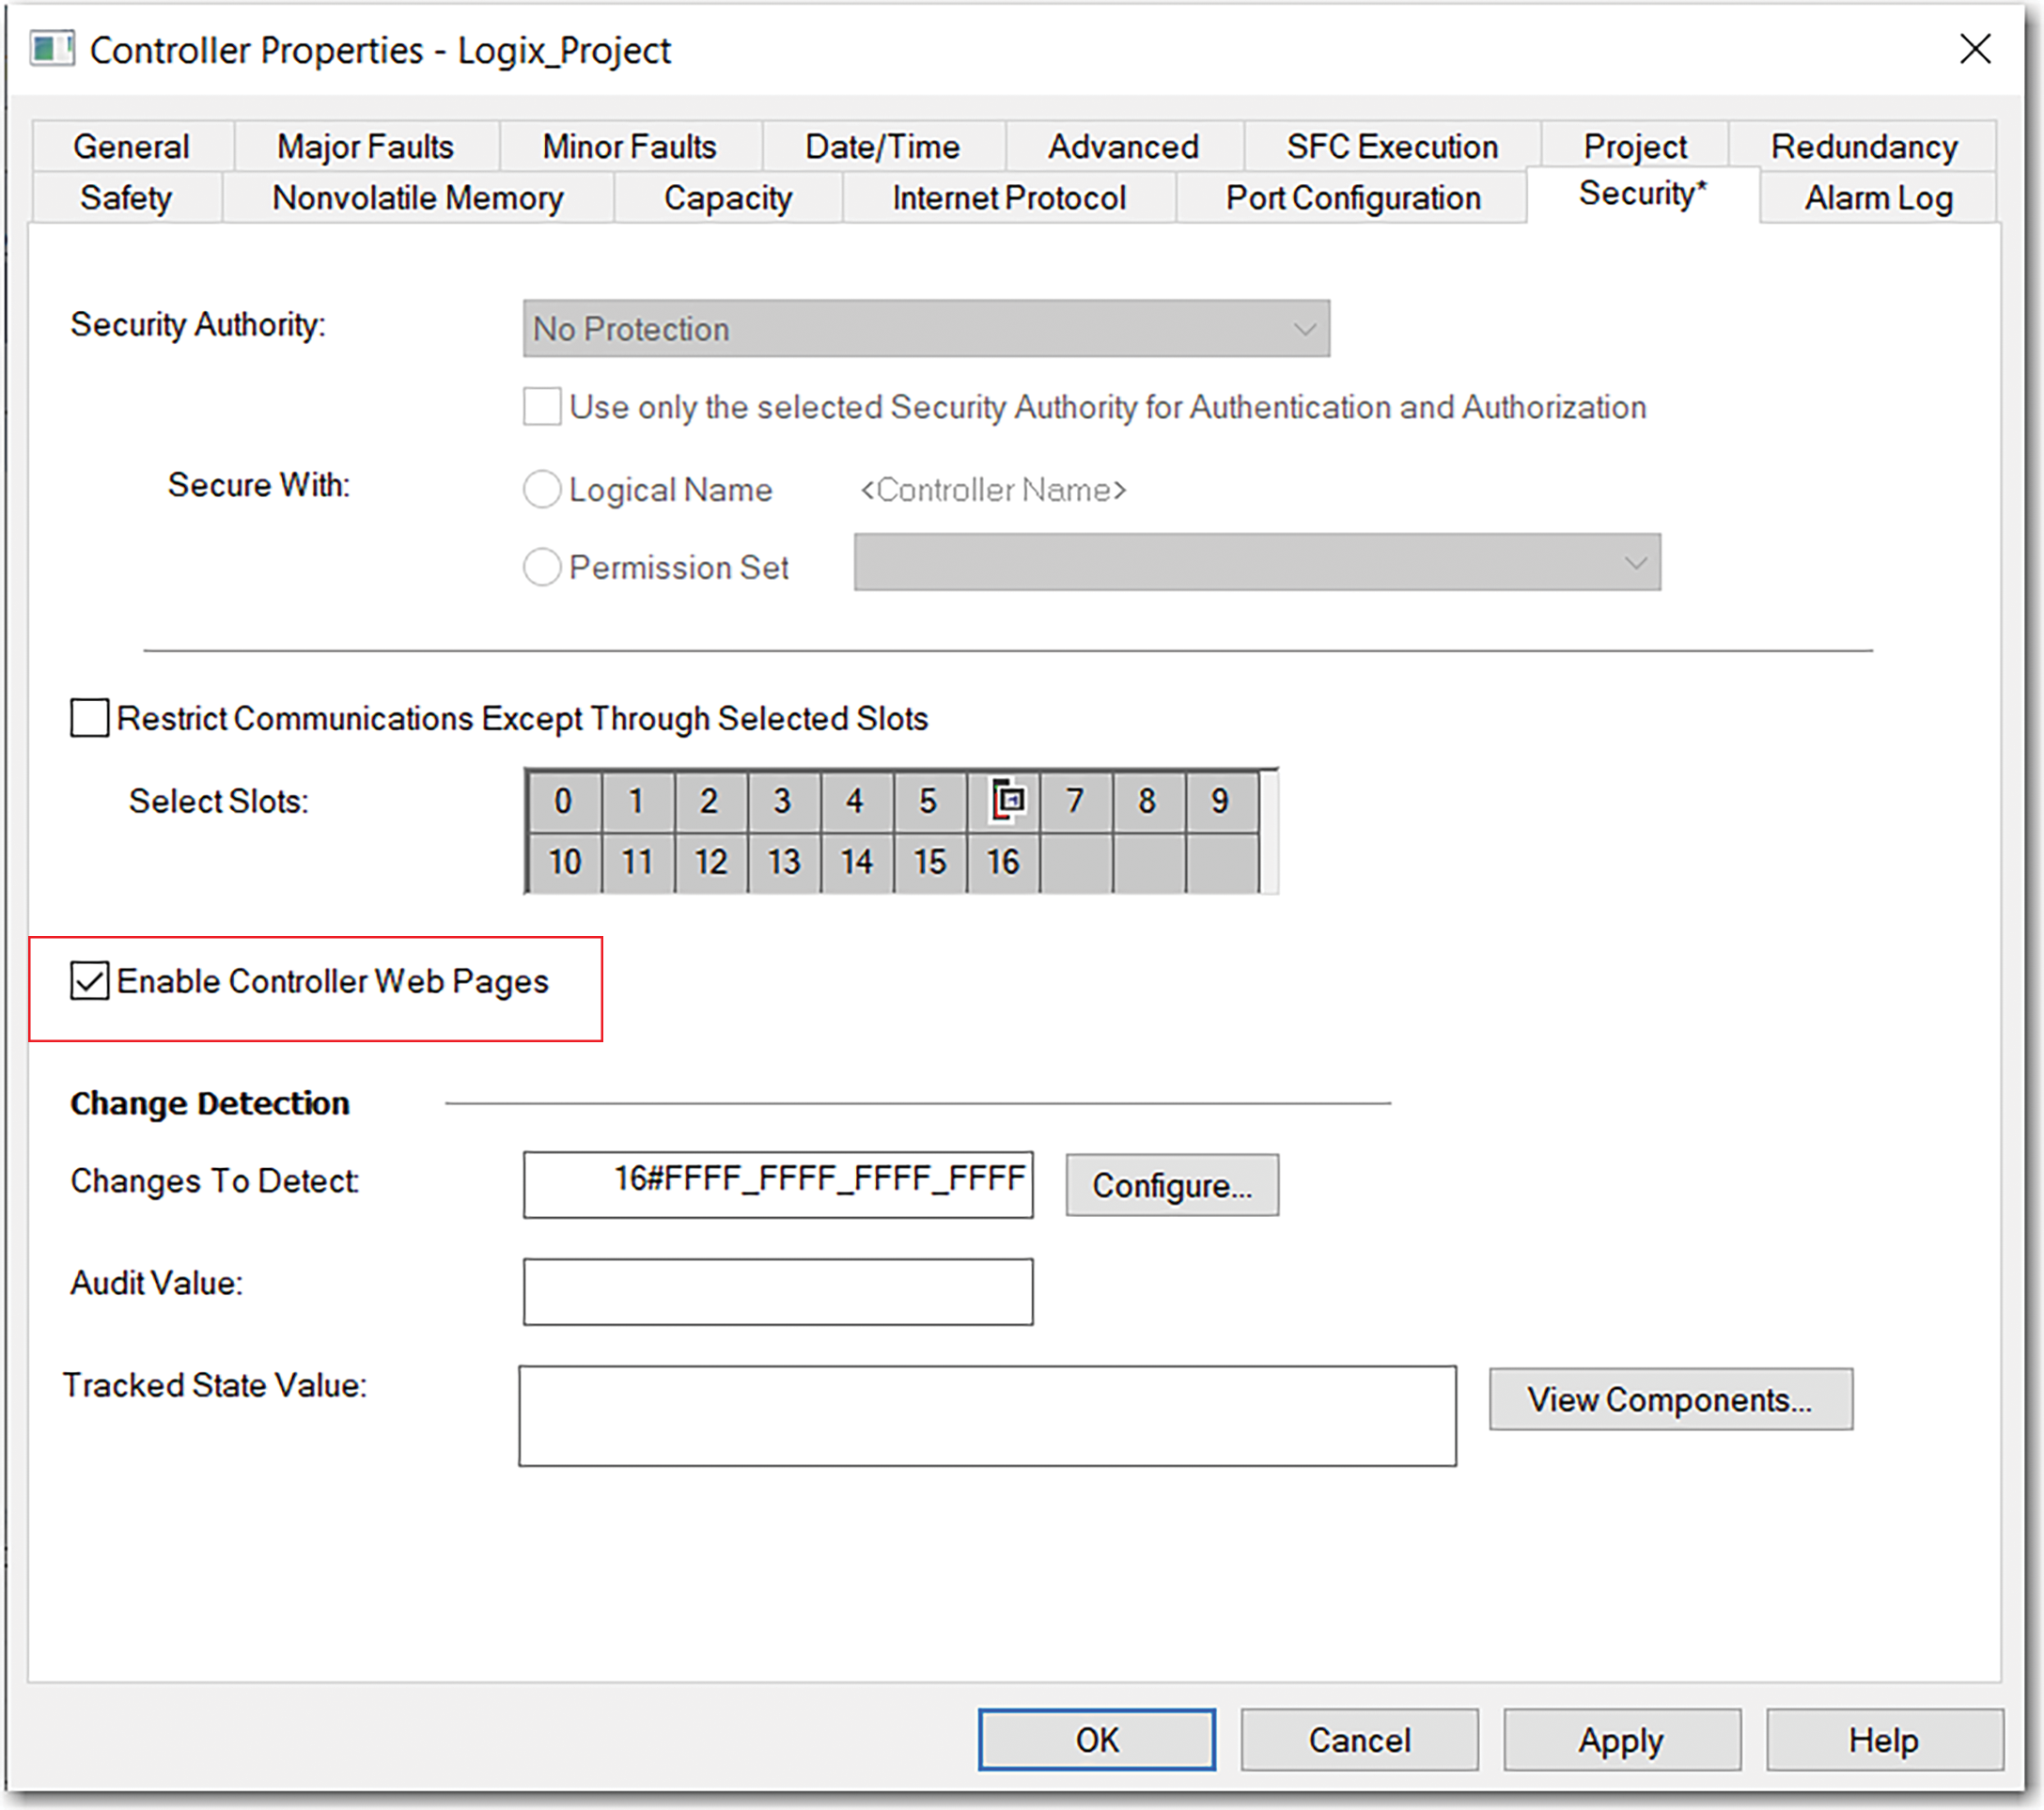
- To enable the controller webpages, select the checkbox on the Security tab of the controller properties.
- ForCIP Security™applications, you can also useFactoryTalk® Policy Managerto enable the webpages.FactoryTalk® Policy Manageroverrides the Controller Properties checkbox.
To access the diagnostic webpages, follow these steps.
- Open your web browser.
- In the Address field, type the IP address of the controller and press Enter.
- To access the diagnostic webpages, use the links in the left-side navigation bar. Some links are only accessible if you open the folder in which they exist.
EtherNet/IP settings and safety applications can slightly modify the web pages. In general, the web pages offer:
- Home webpage provides device information and controller status
- Faults webpage shows major and minor faults on the controller.
- Diagnostics webpages provide communications and messaging data for the controller.
- Tasks webpage shows CPU utilization of the control and communications cores and summarizes the tasks that are running in the controller.
- Browse Chassis webpage lets you view module information, backplane statistics, and connection statistics for modules in the local chassis.
Provide Feedback