Loading
Innovation Center LOGO
Recent ActivityRecent Activity

Energy Monitoring using FT Optix

Energy monitoring is the first step in understanding the behavior of my equipment and my plant. The idea is to be able to structure our energy consumption hierarchy as we have it in our plant. - [Implementation time: 60 Minutes]
Innovation Center Home Page
Smart energy grid utilization with cutting-edge display.
Innovation Center LOGO
  • Overview
  • Installation Guide
  • Downloads
  • Contact us
  • I want to subscribe.
Innovation Center Home Page

What is this for?

The application was developed using FactoryTalk Optix software. The main objective of this application is to monitor energy (WAGES). In this example, we consider electrical energy, but this is the basis for developing the faceplates for the other WAGES. This solution uses Optix's ability to structure objects associated with data and graphics in dashboards.

Another objective is to be able to utilize visualization features, data management, and programming structures using C# and an example of HTML development with JS. The platform allows our operations to be at the forefront with technological solutions that help us facilitate the challenges of today's industry.

General Features

FactoryTalk Optix can help improve your processes, efficiency, and end products—all with one easily accessible tool. Leverage the levels of collaboration, scalability, and interoperability you need to achieve your digital transformation vision.

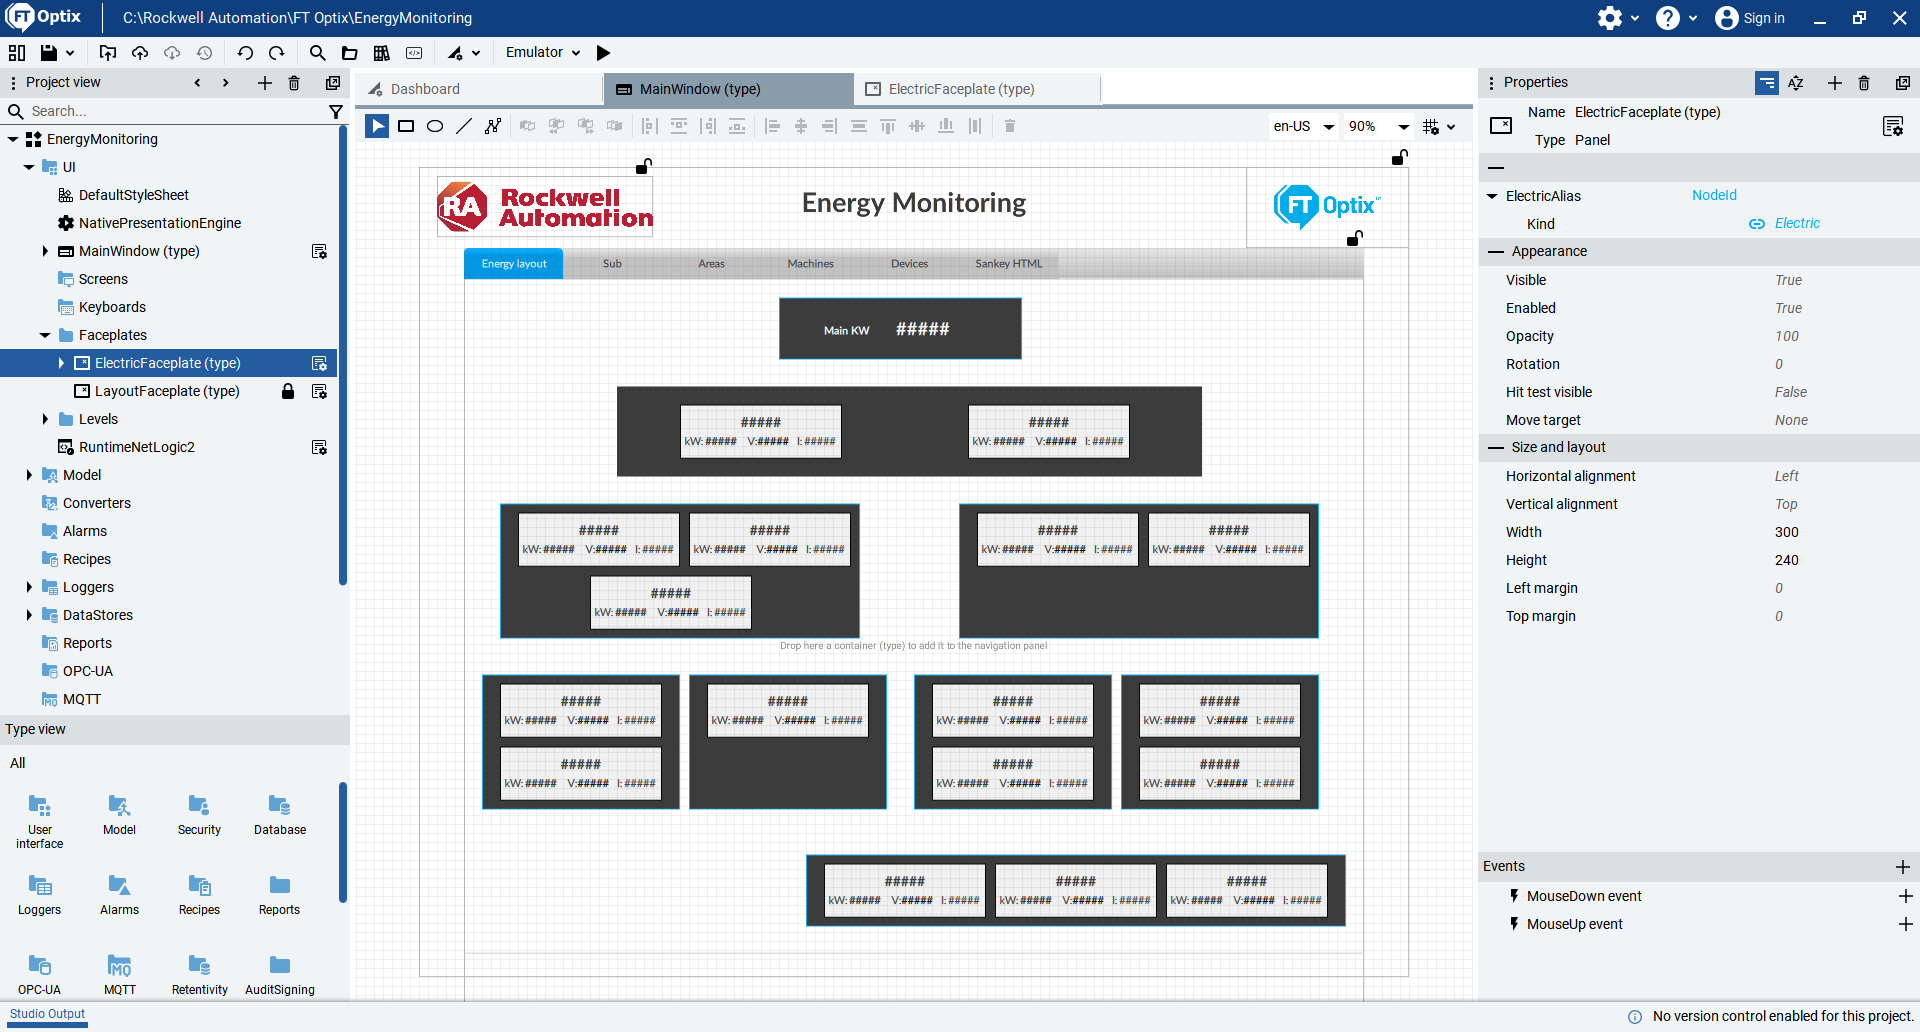
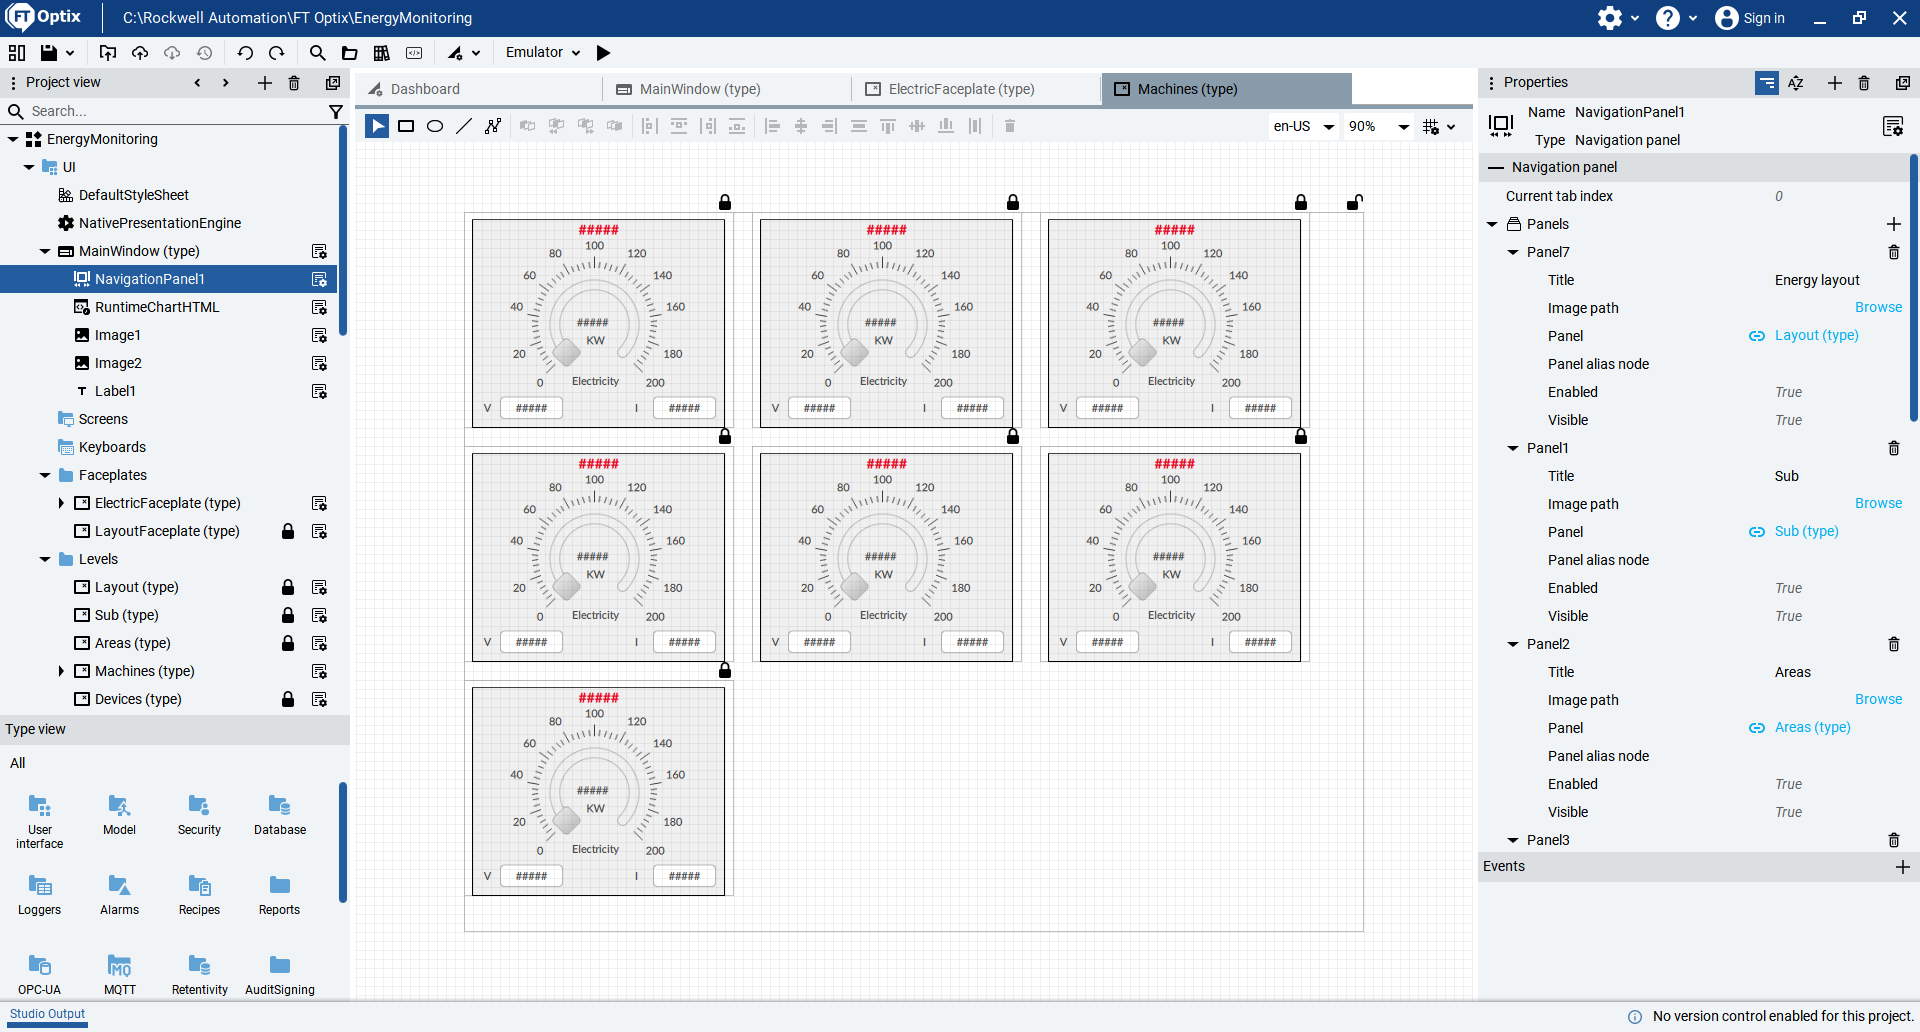
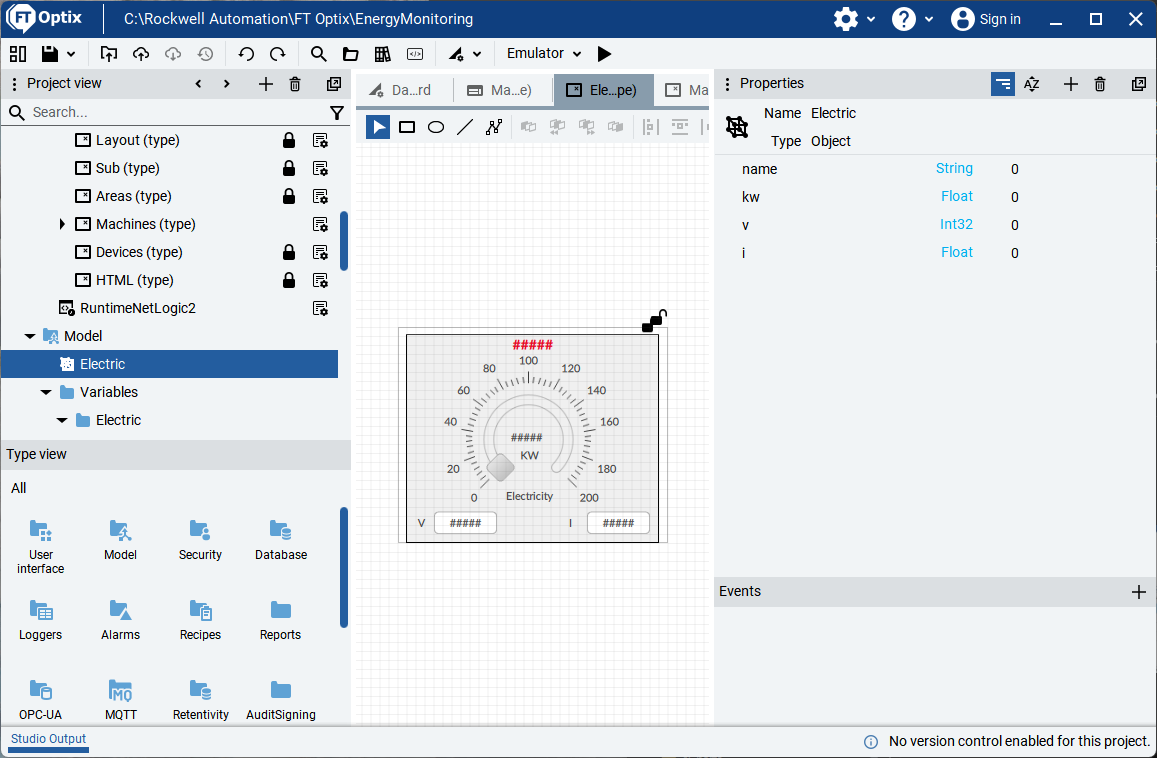
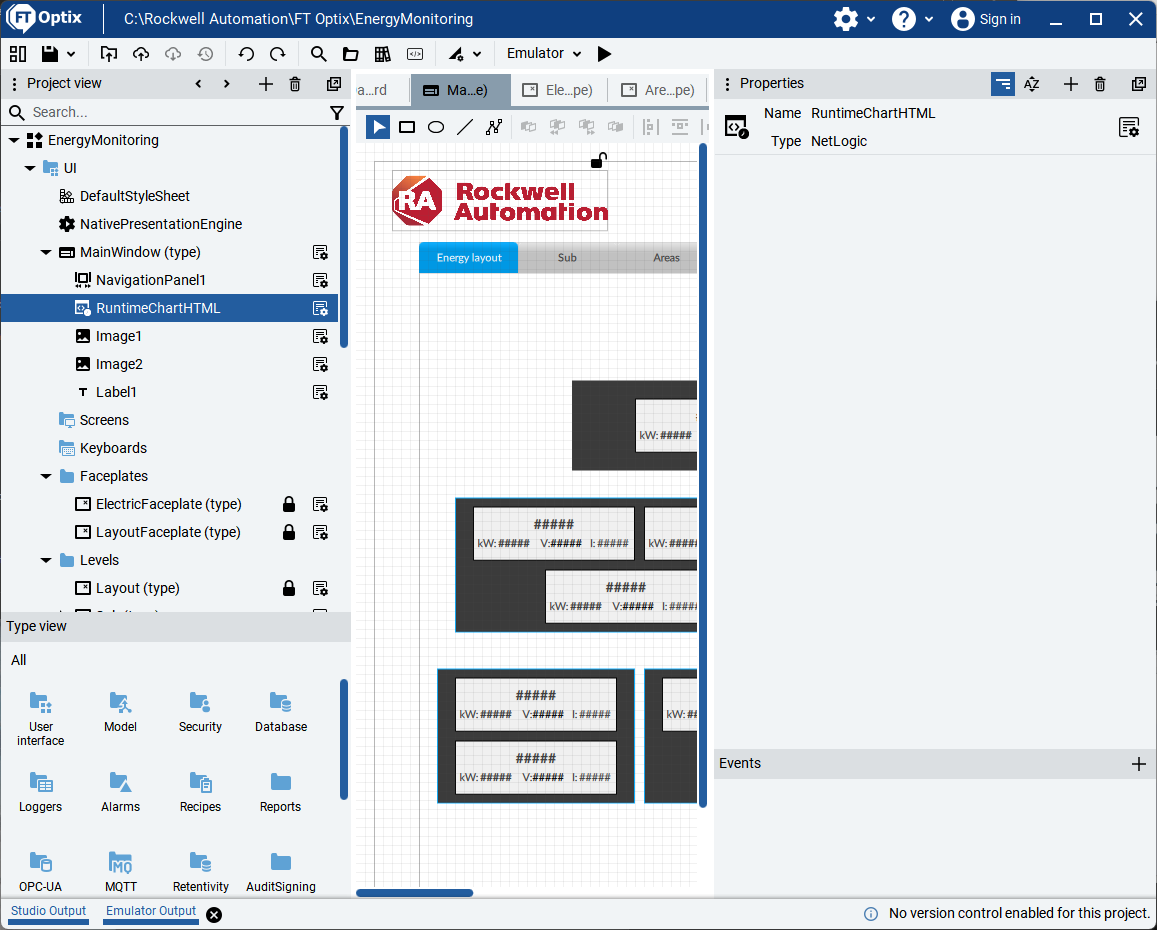
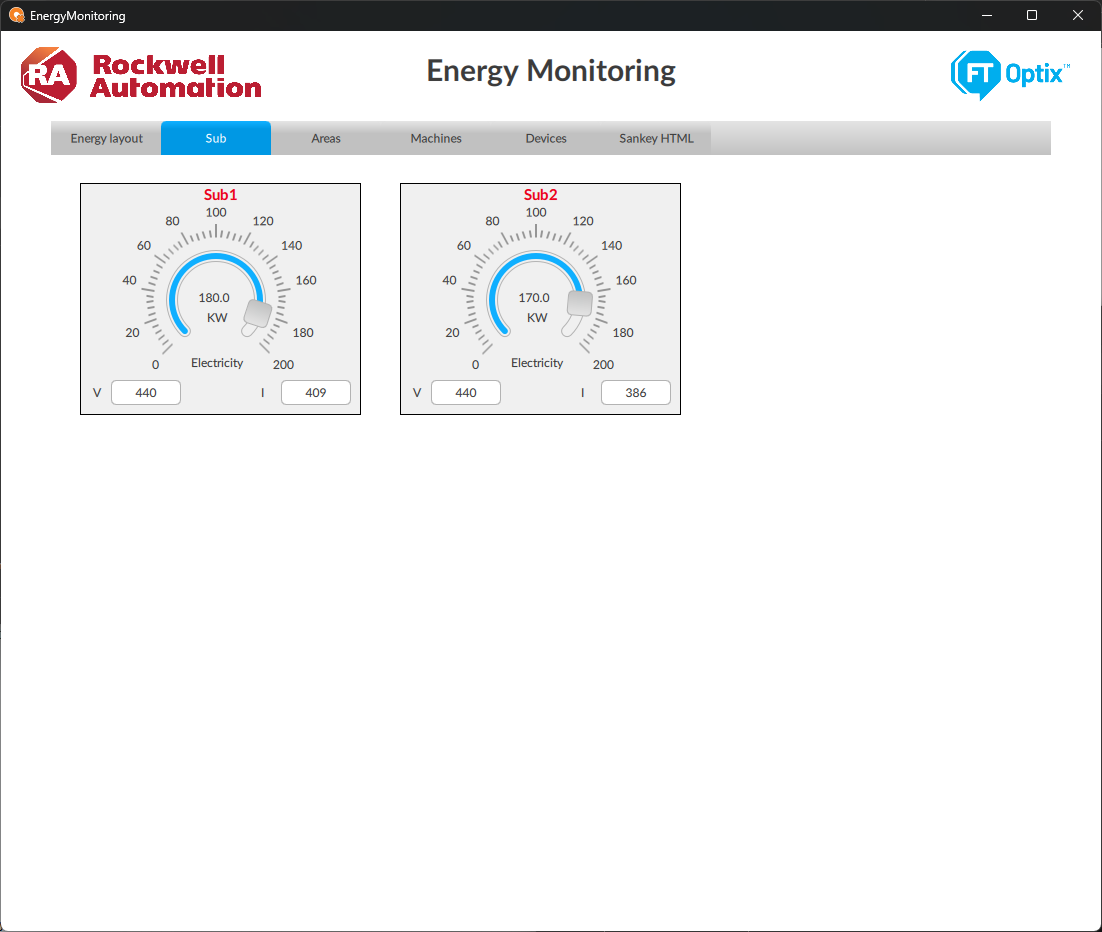
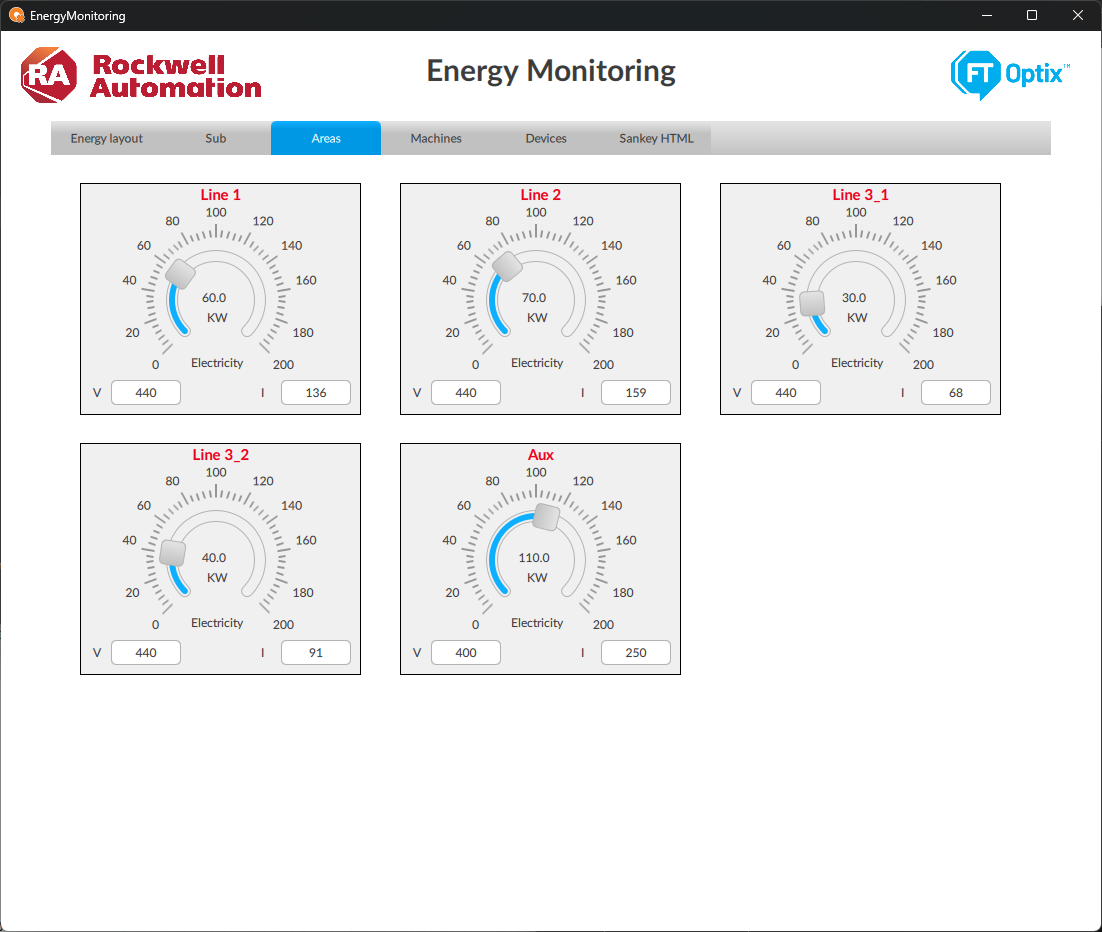
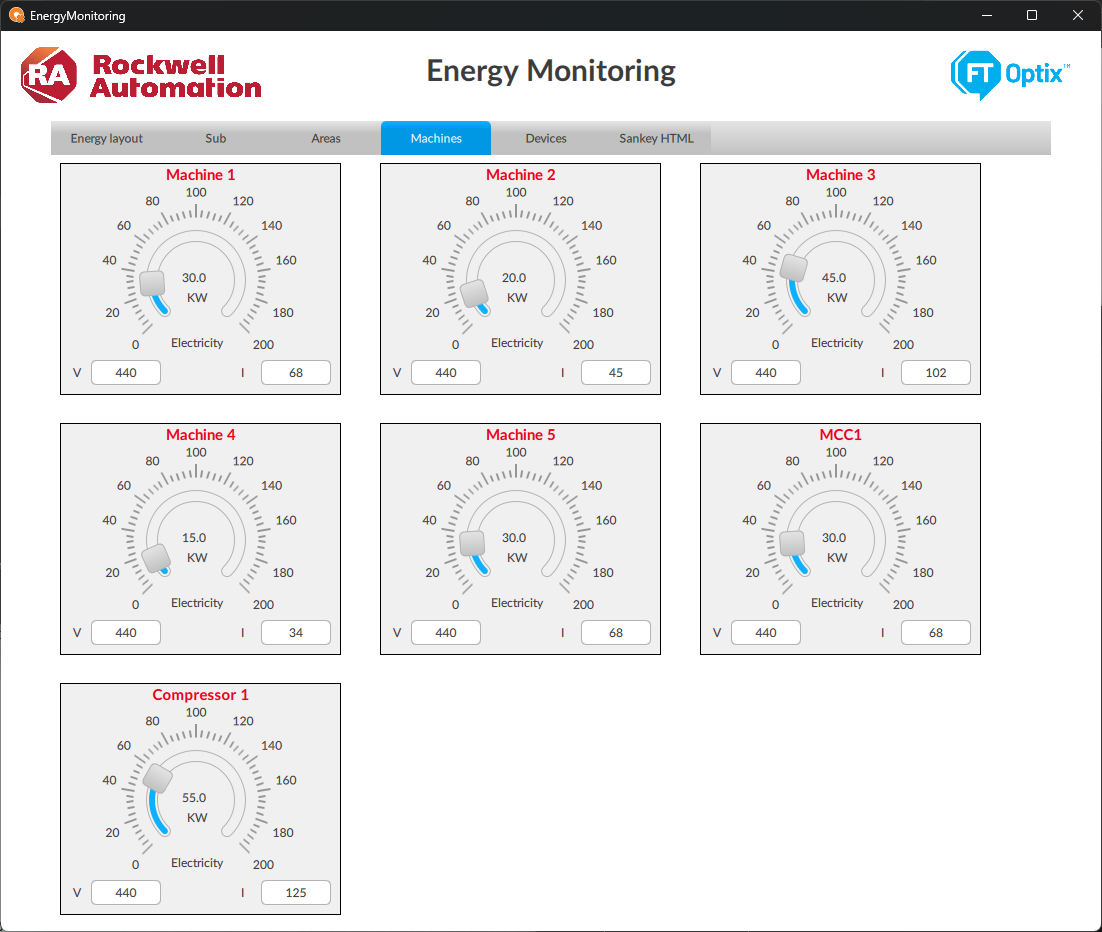
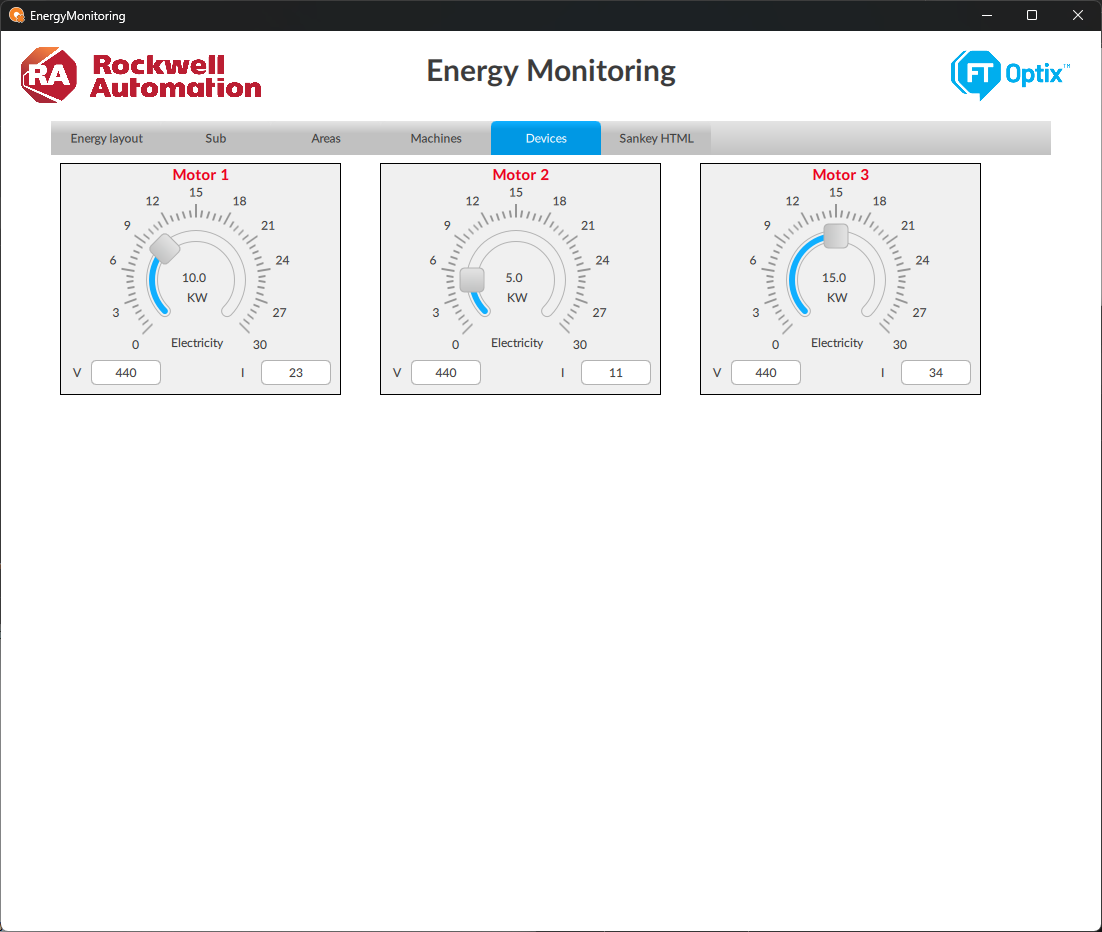
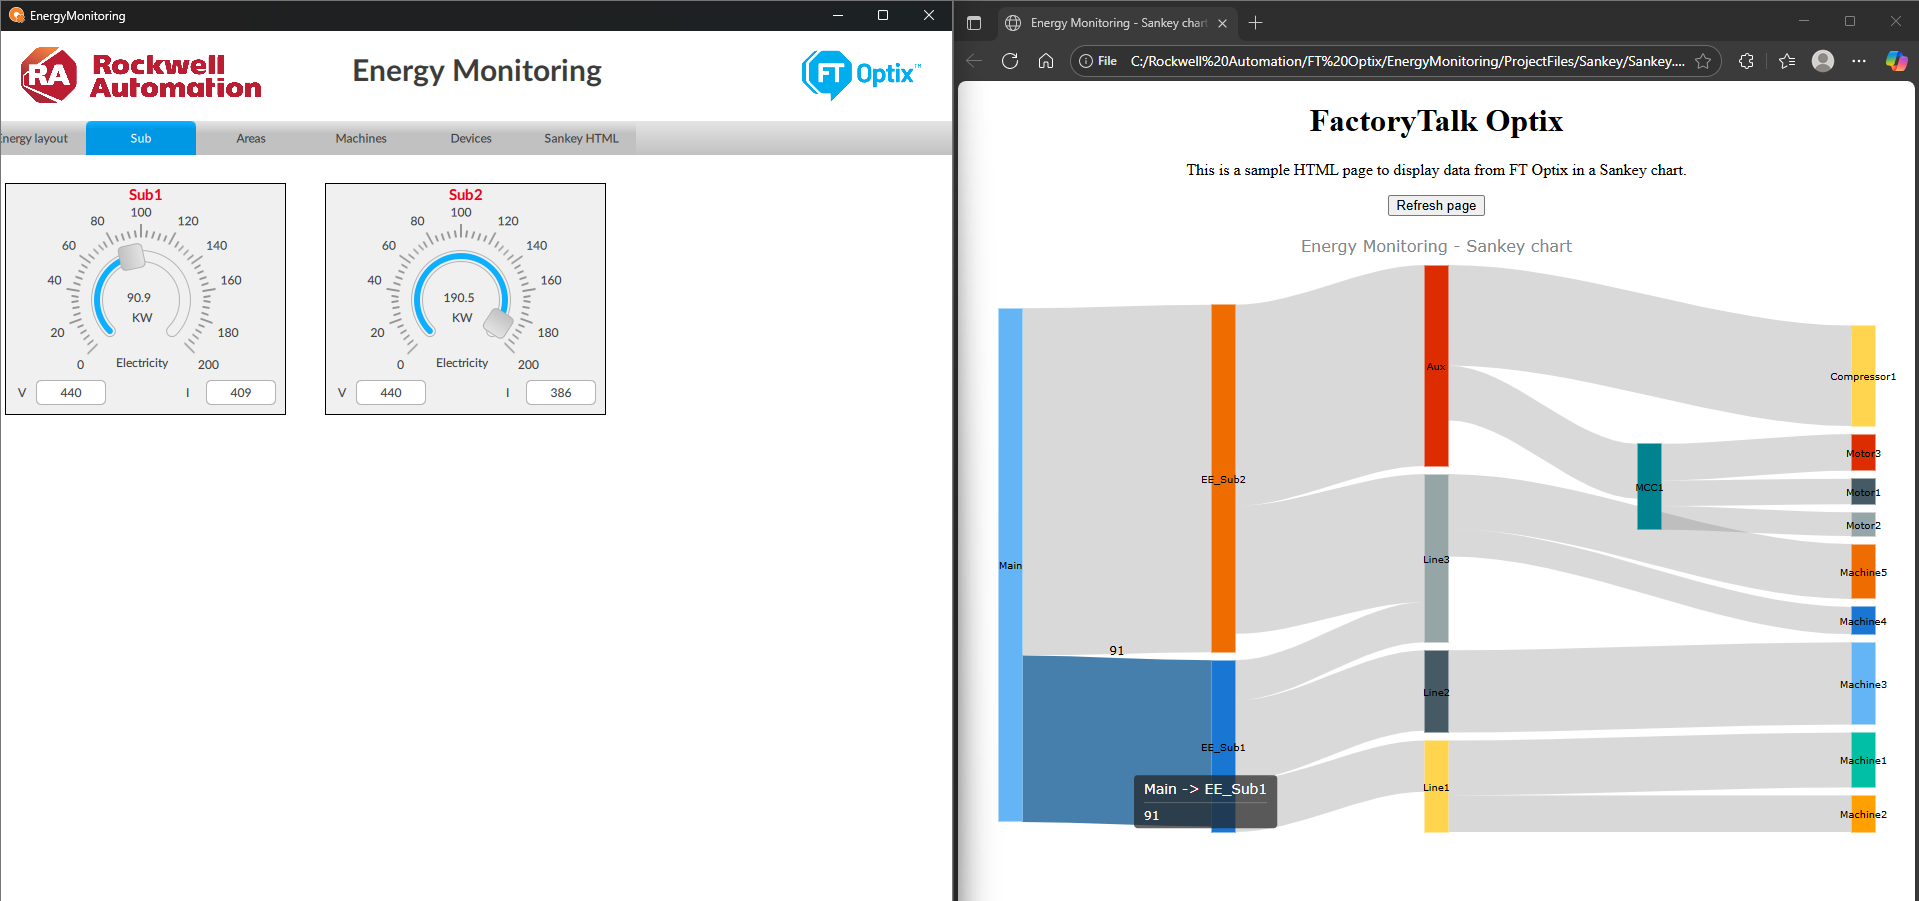
FT Optix stands out for its ability to connect to a wide variety of industrial devices and protocols such as OPC UA, Ethernet/IP, Profinet, Modbus, HTTPS, MQTT, and many others. This capability enables the integration and real-time monitoring of equipment from different manufacturers from a single IoT platform. Additionally, FactoryTalk Optix offers the ability to create data logs and save this information in a SQL database.

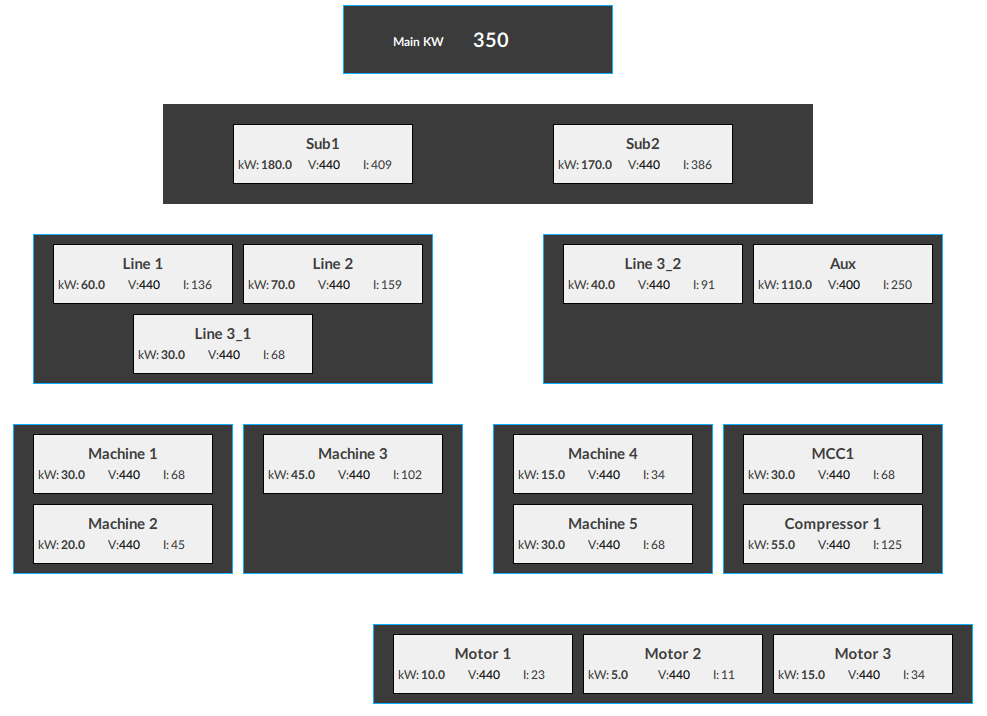
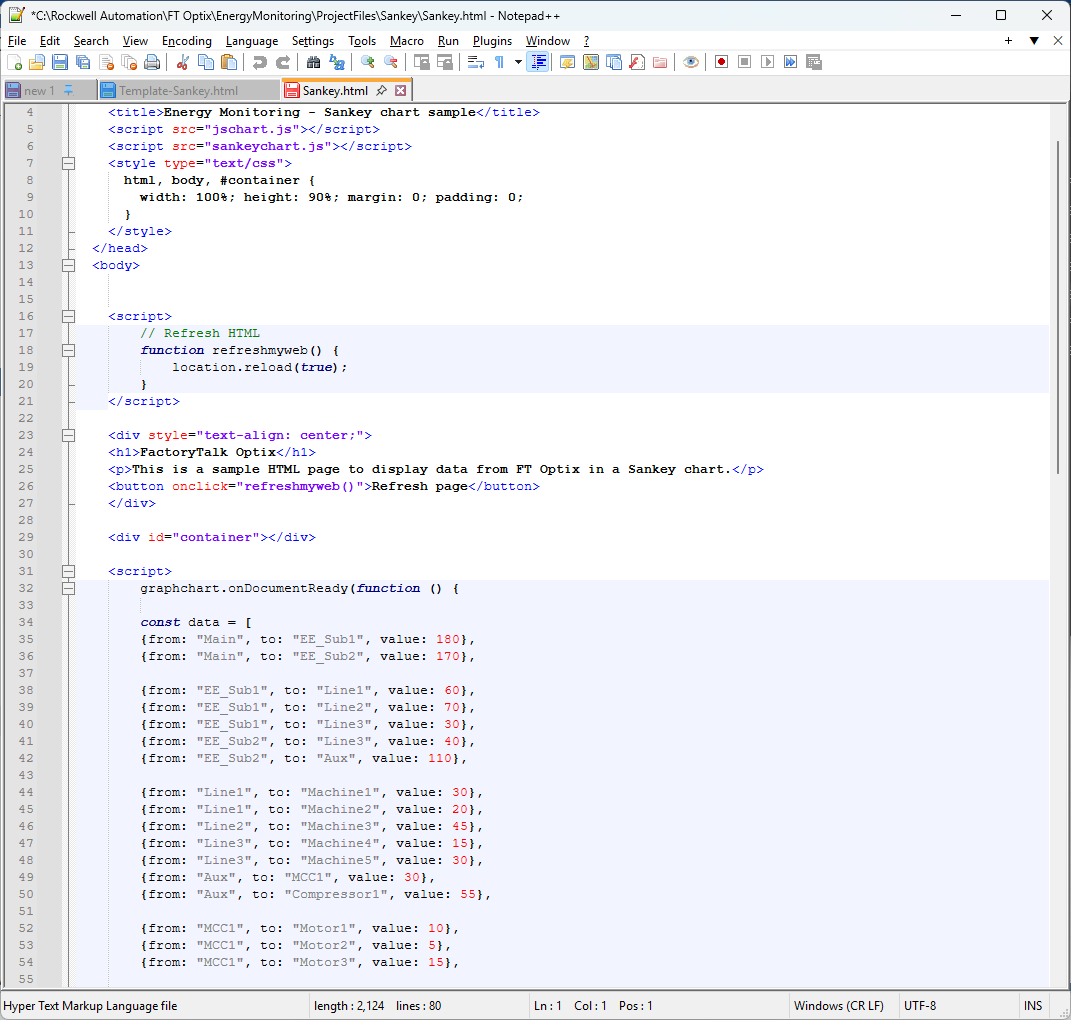
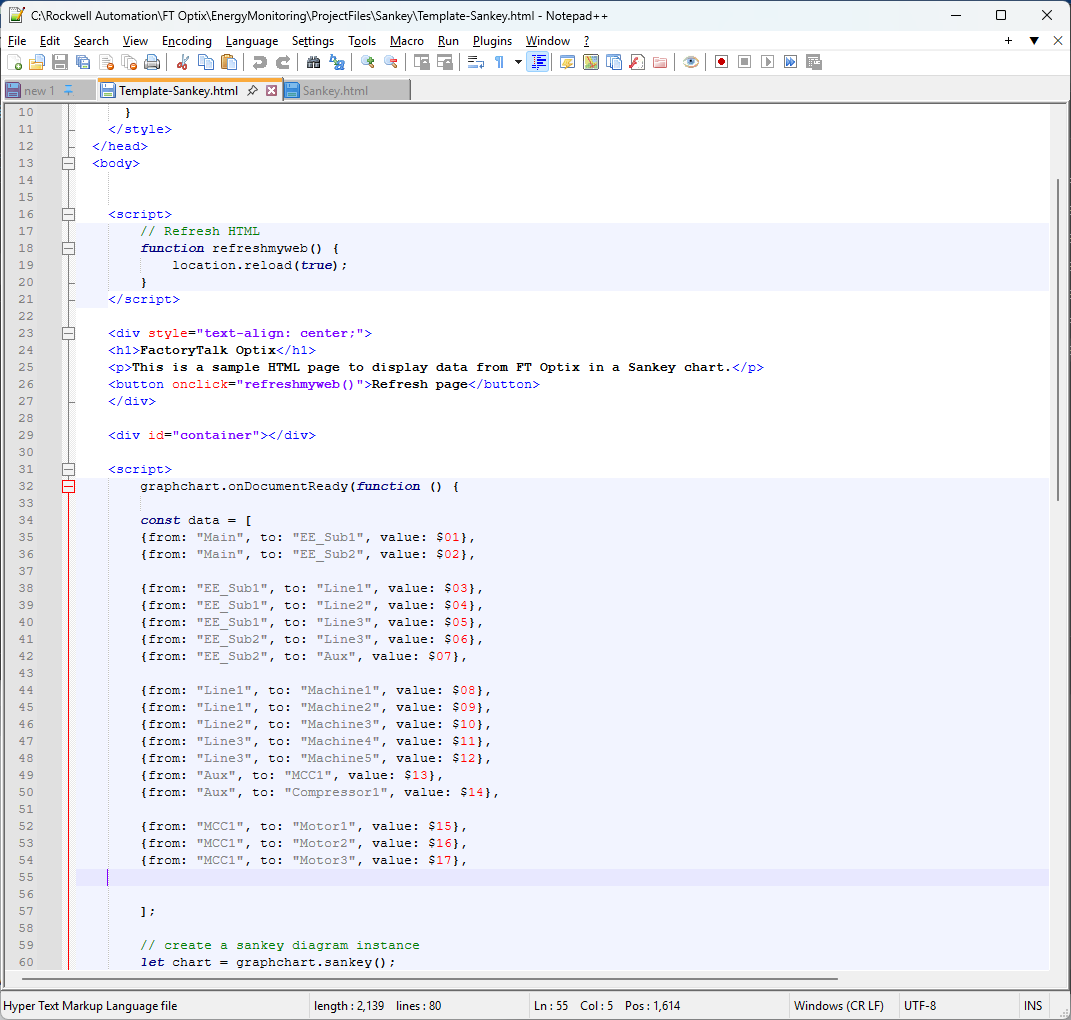
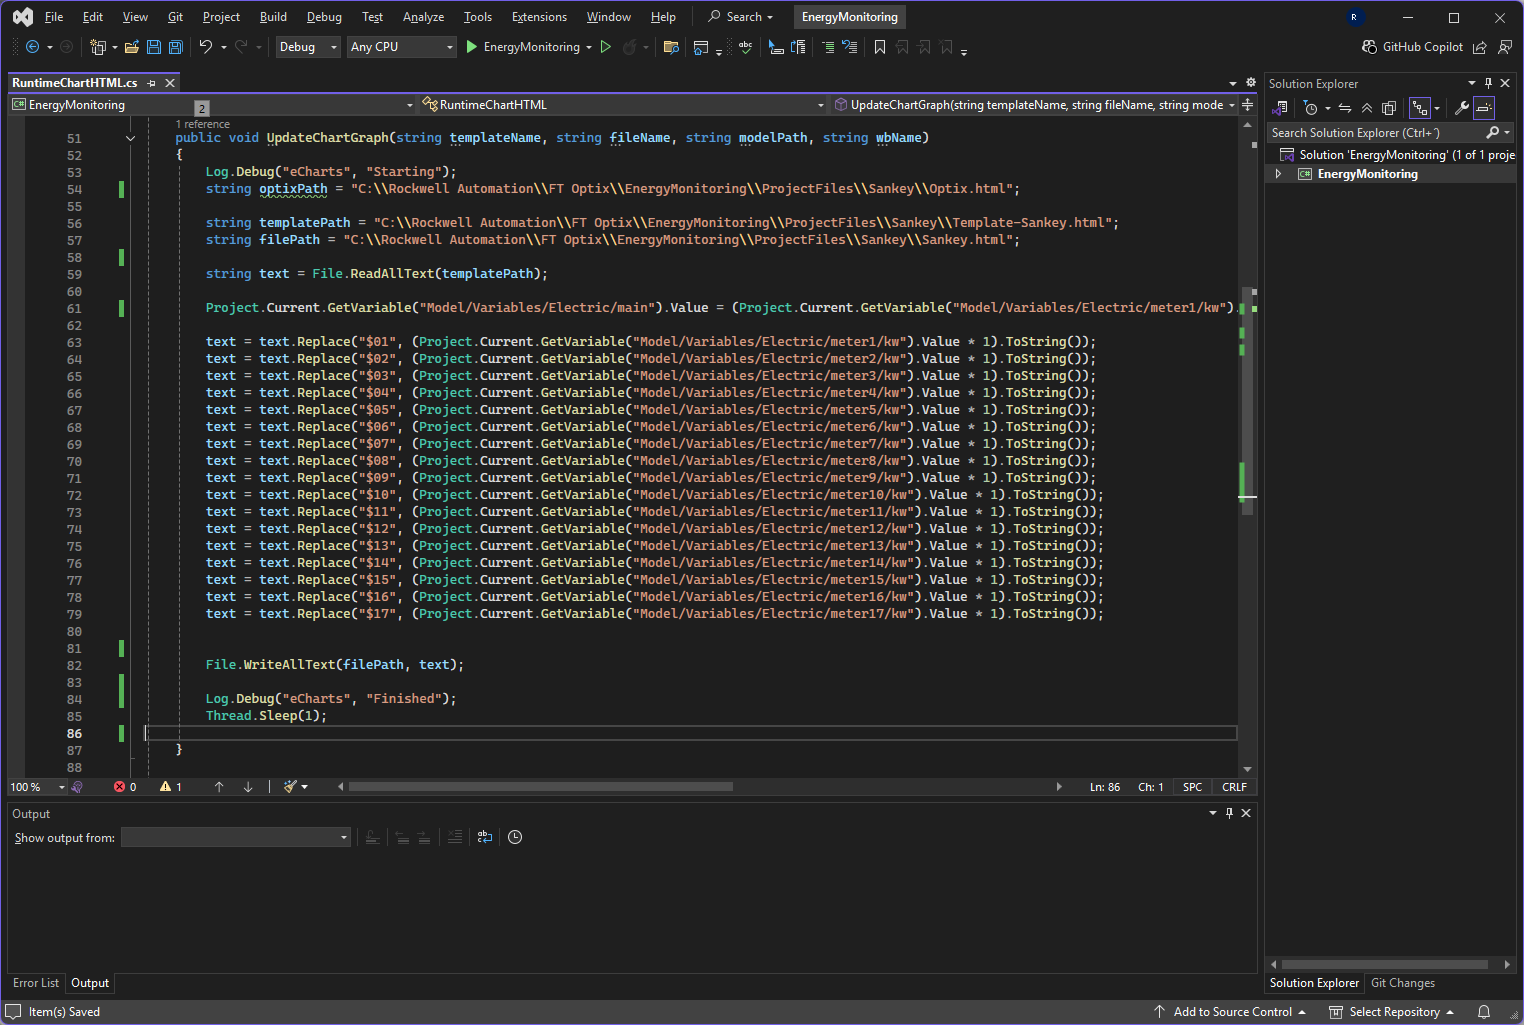
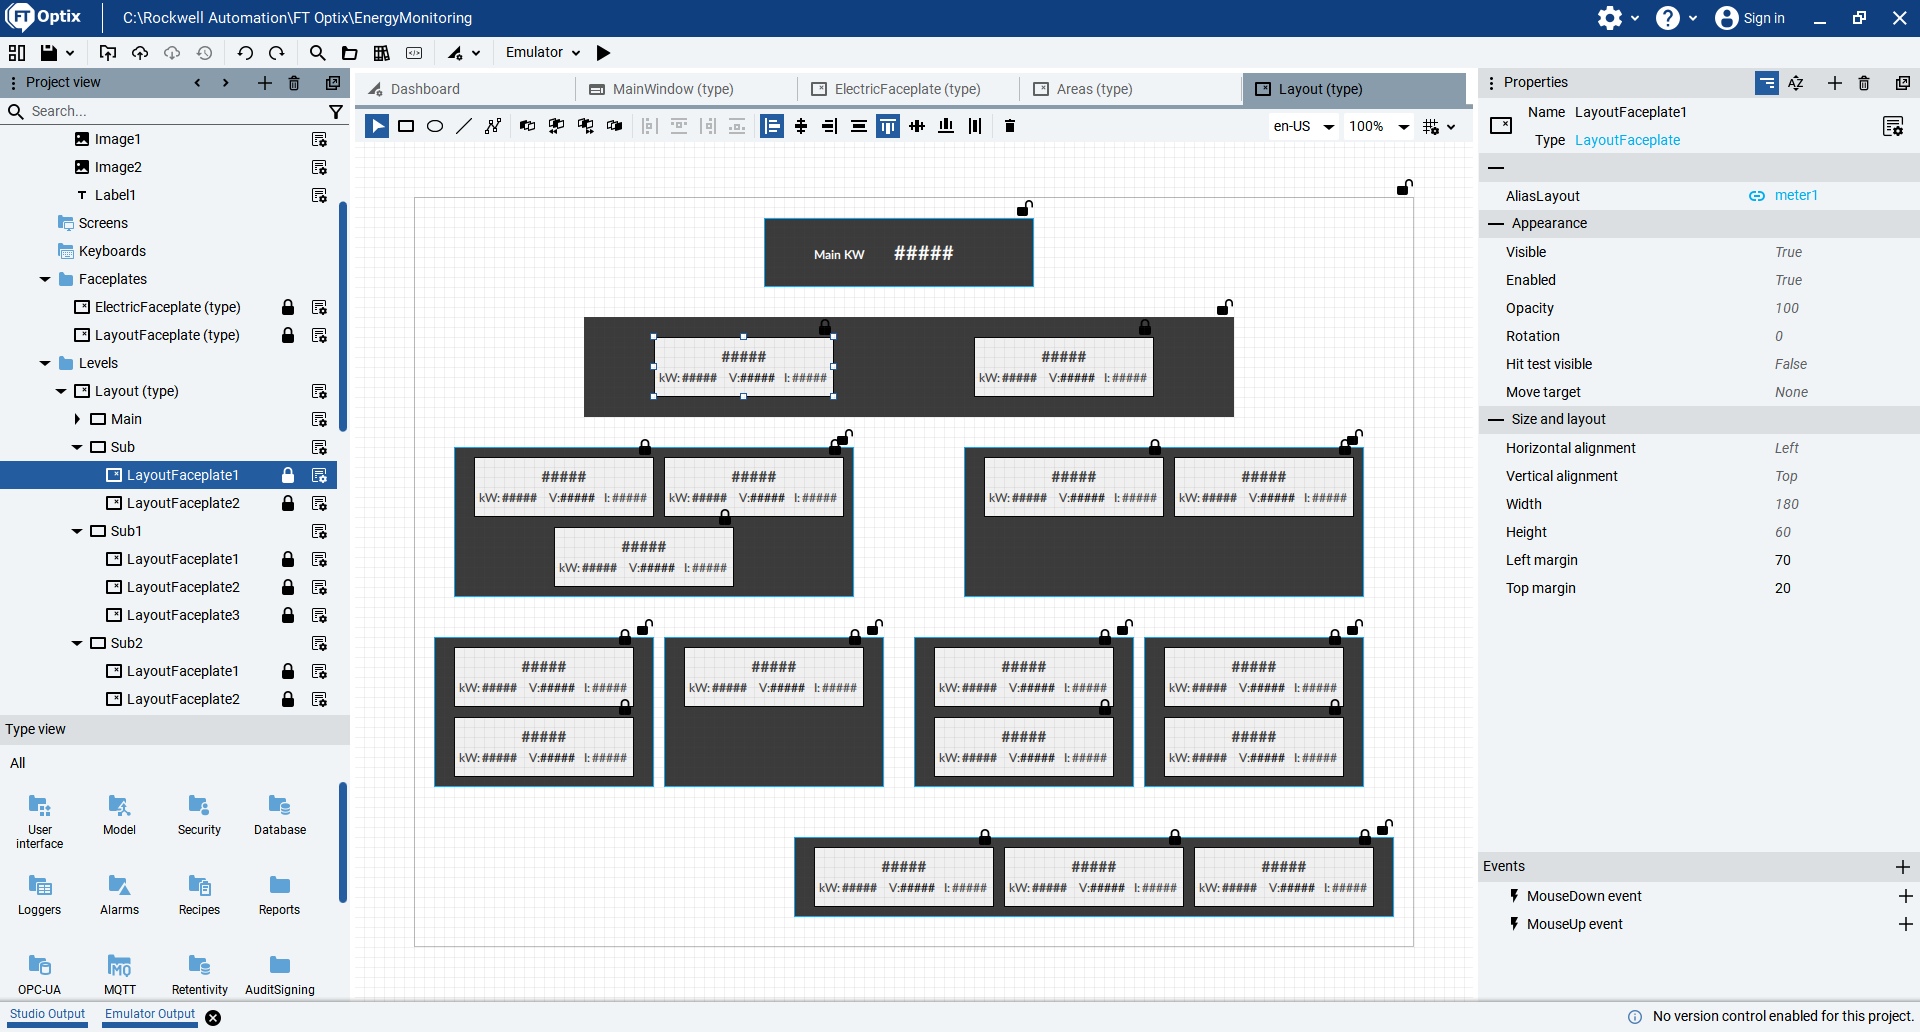
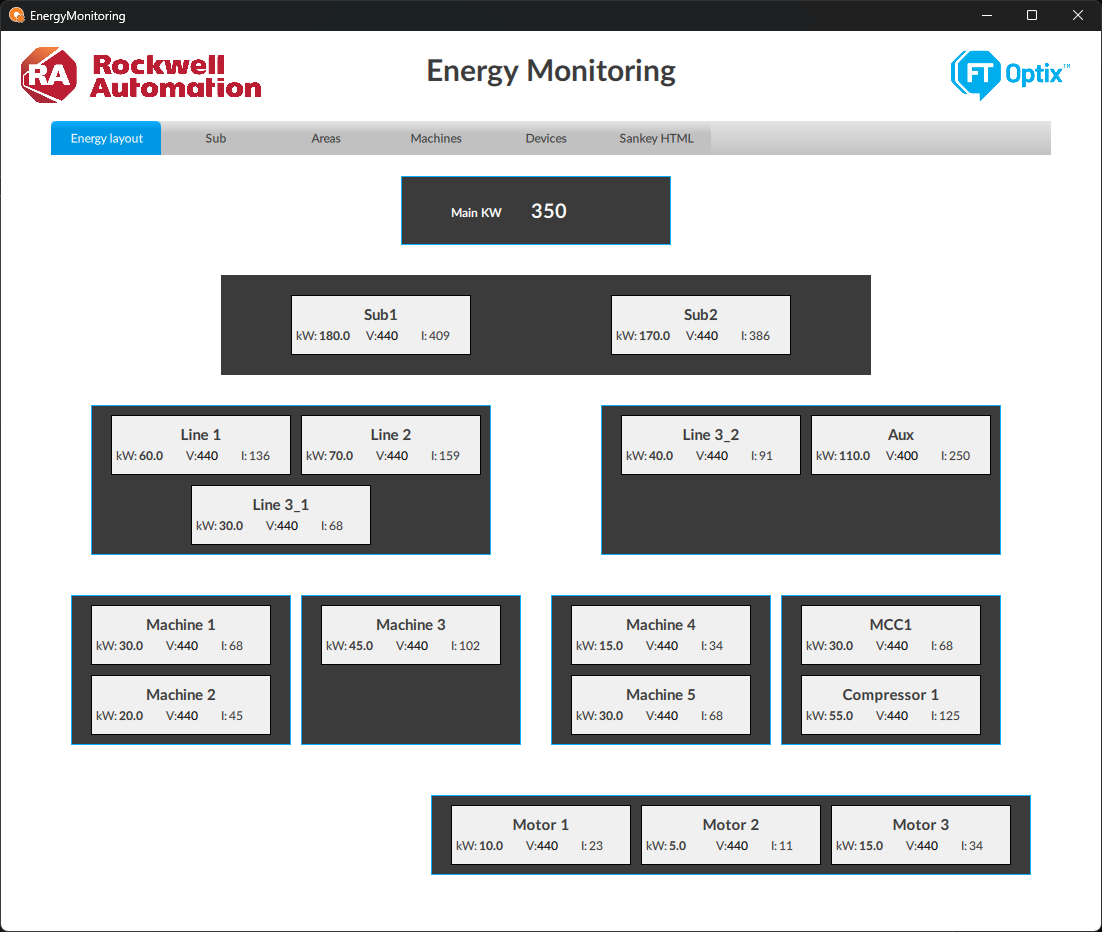
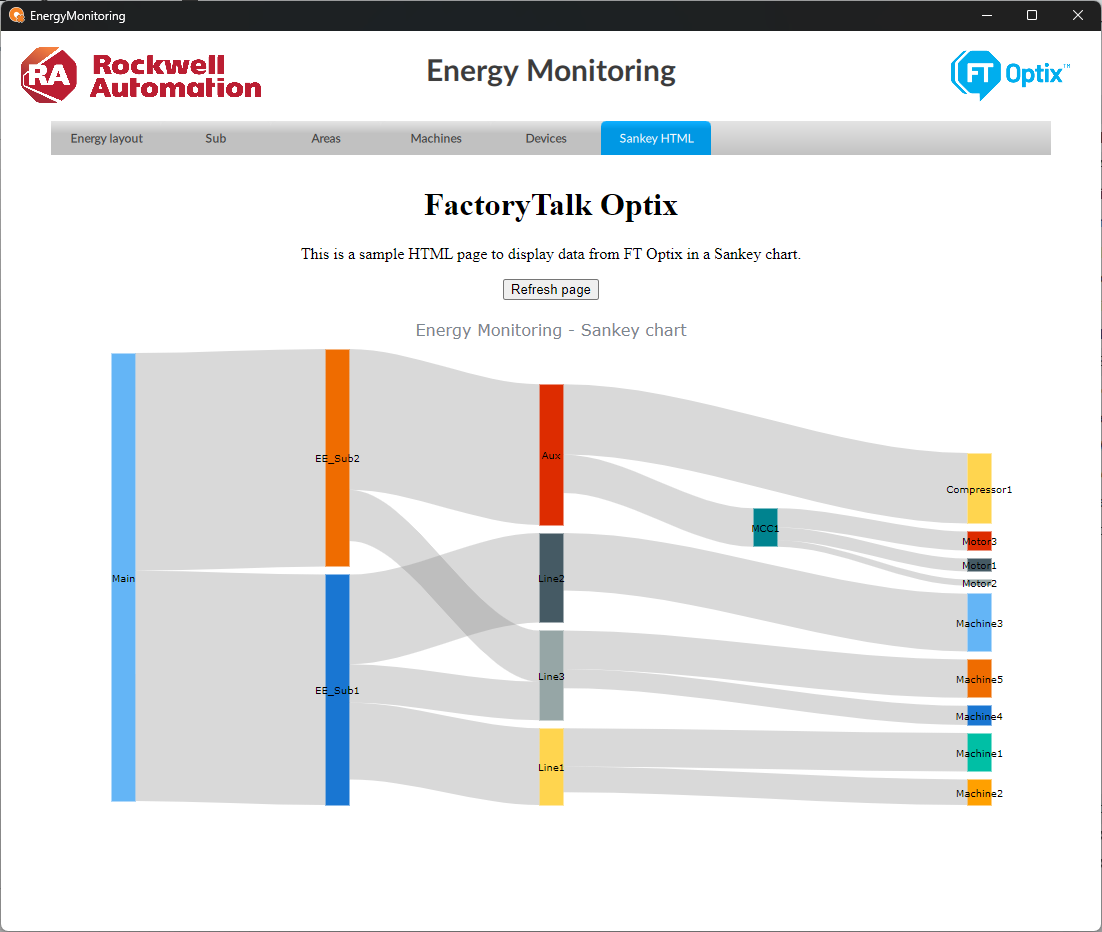
Using FT Optix as a visualization platform is essential; however, it also helps us send information to other structures or files, such as HTML web pages. In this case, we will use code to display a Sankey chart and analyze the energy in our example. However, you can use other charts that you can develop or search for as a complement. The idea is that you can identify how to send data in real time via FT Optix.


Advantages

  • Use of structured code
  • Connectivity flexibility
  • Impact on development time
  • Notifications based on the operating model
  • Sending data to HTML web pages
  • High reliability
  • Compatible for implementation in your applications
  • Flexibility and scalability
  • Improved information flow
  • Data optimization
  • Real-time monitoring
  • Information analysis
AHIC Download ICON VF.png

Downloads

Please note: You will need to agree to the Terms & Conditions for each download.

Downloadable file ›
Legal Disclaimer Acceptance. ROCKWELL AUTOMATION WILL PROVIDE ACCESS TO ROCKWELL PRODUCTS (BEST PRACTICES, APPLICATIONS AND KNOWLEDGE) ON THE CONDITION THAT YOU ACCEPT AND COMPLY WITH THE FOLLOWING TERMS AND CONDITIONS. YOU ACCEPT AND AGREE TO BE BOUND BY THE TERMS OF THIS AGREEMENT BY DOWNLOADING, INSTALLING, COPYING, OR OTHERWISE USING PRODUCTS. IF YOU ARE ACCEPTING THESE TERMS ON BEHALF OF ANOTHER PERSON, COMPANY, OR OTHER LEGAL ENTITY, YOU REPRESENT AND WARRANT THAT YOU HAVE FULL AUTHORITY TO BIND THAT PERSON, COMPANY, OR LEGAL ENTITY TO THESE TERMS. IF YOU DO NOT AGREE TO THESE TERMS, DO NOT DOWNLOAD, INSTALL, COPY, ACCESS, OR USE THE PRODUCTS, SOFTWARE AND/OR CLOUD SERVICES. 1. Rockwell Automation retains full ownership and title to all Products and related documentation. No rights or licenses are granted other than those set forth in this Agreement. Company grants to Rockwell Automation a non-exclusive, worldwide, royalty-free, perpetual, non-revocable license to use any feedback Company provides regarding the Products, even if Company has designated the feedback as confidential. Rockwell Automation will be entitled to use the feedback without restriction or compensation to Company. 2. Company may not lease sub-lease, assign, license, sub-license or otherwise transfer any of the Products without the prior written consent of Rockwell Automation. Company may not assign or otherwise transfer access rights to the Products without the prior written consent of Rockwell Automation. Any reverse assembly, reverse engineering, decompilation, and creation of derivative works based on the Products by Company is prohibited. 3. Company acknowledges that Products provided under this Agreement are Rockwell Automation’s Confidential Information and are covered by effective or pending copyrights, patents, trademarks and/or trade secrets of Rockwell Automation, and Company agrees to maintain confidentiality by not disclosing Products or documentation to any third party without the prior written consent of Rockwell Automation and to protect the confidentiality of the Products as it would Company’s own confidential information. Company agrees that its obligation of confidentiality under this paragraph shall survive expiration or termination of this Agreement. 4. Company agrees that Products provided under this Agreement are prototypes and examples and its application and results may vary depending on each customer and project conditions. Rockwell Automation do not warranty the same results. This Agreement shall in no way be construed as a commitment by Rockwell Automation at any time to manufacture and/or offer Products for sale. There is no explicit or implicit service level agreement associated with using the Products. Rockwell Automation does not warrant that the functions contained in the Products will meet Company’s requirements. Company agrees to use all Products only in accordance with the instructions and only for the intended usages identified in the documentation. 5. EXCLUSION OF WARRANTIES AND LIMITATION OF LIABILITY. THE PRODUCTS ARE PROVIDED "AS IS". ROCKWELL AUTOMATION DISCLAIMS ANY AND ALL WARRANTIES, EXPRESS, IMPLIED OR STATUTORY, INCLUDING WITHOUT LIMITATION ANY WARRANTIES OF MERCHANTABILITY OR FITNESS FOR A PARTICULAR PURPOSE. ROCKWELL AUTOMATION EXPLICITLY DISCLAIMS ALL WARRANTIES OF NON- INFRINGEMENT AND EXPRESSLY DOES NOT WARRANT THAT THE PRODUCTS, IN WHOLE OR IN PART, WILL BE ERROR FREE OR FREE FROM SECURITY VULNERABILITIES. IN NO EVENT SHALL ROCKWELL AUTOMATION BE LIABLE FOR (i) LOST PROFITS, LOST SAVINGS, DOWNTIME, SPECIAL, INDIRECT OR CONSEQUENTIAL DAMAGES OF ANY KIND, OR (ii) ANY PERSONAL INJURY, PROPERTY DAMAGE OR ENVIRONMENTAL DAMAGE ARISING OUT OF OR IN CONNECTION WITH THIS AGREEMENT, WHETHER IN AN ACTION IN CONTRACT, STRICT LIABILITY OR IN TORT INCLUDING NEGLIGENCE. 6. COMPANY AGREES TO INDEMNIFY AND HOLD ROCKWELL AUTOMATION HARMLESS FROM ALL COSTS, AWARDS, DAMAGES, EXPENSES AND FEES (INCLUDING ATTORNEYS FEES) RESULTING FROM OR RELATED TO ANY THIRD-PARTY CLAIMS (INCLUDING EMPLOYEES AND AGENTS OF COMPANY) AGAINST ROCKWELL AUTOMATION, ITS DISTRIBUTORS, AGENTS, OFFICERS, DIRECTORS OR EMPLOYEES FOR PERSONAL INJURY (INCLUDING DEATH), PROPERTY DAMAGE OR ENVIRONMENTAL DAMAGE RELATED TO OR RESULTING FROM THE USE OF THE PRODUCTS. 7. In the event a Product is exported, Company agrees to comply with all applicable United States Export Control Law and Regulations, and the applicable export control laws of other countries. This Agreement shall be governed by the laws of the state of Wisconsin. This Agreement is the complete and exclusive Agreement between Rockwell Automation and the Company, and supersedes all prior agreements, whether written or oral, relating to the Products.
AHIC NEED HELP ICON VF.png

Need Help?

If you need help with an application or have feedback from the Innovation Center, please contact us.


Is this useful to me?

Being able to monitor assets or energy consumption is the first step in understanding the behavior of my equipment and my plant in general. The idea is to structure our energy consumption hierarchy as we do at our plant.

This application is the basis for developing the WAGES faceplates you need to monitor and can complement your real-time data analysis projects by sending data to graphs in HTML pages.

It is applicable to any industry or industrial segment where you want to begin analyzing and monitoring plant energy consumption.

This functionality can be replicated as many times as necessary in your projects, increasing the value of your products, optimizing implementation costs, and leveraging the data from your meters and instrumentation by monitoring and analyzing the data.


How can I make it work?

Requirements: products, tools, prior knowledge.

  • Hardware
    • Controllers/PLC compatible with FT Optix connectivity.
 
  • Software
    • FactoryTalk Optix (V1.5.6.0) o higher
 
  • Background knowledge 
    • Basic knowledge FactoryTalk Optix, C#, html.


AHIC STEP ICON.png

Implementation Guide

 
  1. Step 1
  2. Step 2
  3. Step 3
  4. Step 4
  5. Step 5
  6. Step 6
  7. Step 7
  8. Step 8
  9. Step 9
Open All Close All
Step 1
 

Download the program file to your FT Optix project folder.

Identify the application you want to use: FactoryTalk Optix.

Open the EnergyMonitoring file in the location where you downloaded it.


Make sure you have the .NET SDK x64 installed

https://dotnet.microsoft.com/en-us/download

Remember the path where you will install the Optix project.


energy-monitor-using-optix_Step 1.png

energy-monitor-using-optix_Step 1

Step 2
 

Step 2.1


Explore the application, open the main window, where you can see the elements that make up this demo.


energy-monitor-using-optix_Step 2_1.png

energy-monitor-using-optix_Step 2_1

Step 2.2


Within the project view you will identify several Folders: Faceplates, Levels, Model, Variables, which we will be reviewing for the creation of the Faceplates and creation of the Navigation Panel.

 
energy-monitor-using-optix_Step 2_2.png

energy-monitor-using-optix_Step 2_2

Step 3
 

Creating a Faceplate - In this case, we will create the Faceplate for electrical energy monitoring.


Step 3.1

An object named Electric is created in the Model folder.

With the basic variables for an electric energy meter:

  • name
  • kw
  • v
  • i
 
energy-monitor-using-optix_Step 3_1.png

energy-monitor-using-optix_Step 3_1

Step 3.2

In the Faceplates folder, create a Panel called ElectricFaceplate, which will be used to register all our electricity meters.

Generate an Alias associated with our Electric Object from the previous Step.

Each object, such as Label, Text Box, and Circular Gauge, is associated with the Alias variable it is to display.

 
energy-monitor-using-optix_Step 3_2.png

energy-monitor-using-optix_Step 3_2

Step 4
 

Create the objects for the meters and define the hierarchical structure of the electric energy meters we have.

Step 4.1

We must consider how many electricity meters we have (in this case, they are simulated; however, you can later associate them with a controller) and define how we will create our hierarchical structure.

In this example, we will have 17 meters:

Meter

Name

1

Sub1

2

Sub2

3

Line 1

4

Line 2

5

Line 3-1

6

Line 3-2

7

Aux

8

Machine 1

9

Machine 2

10

Machine 3

11

Machine 4

12

Machine 5

13

MCC1

14

Compressor 1

15

Motor 1

16

Motor 2

17

Motor 3


With a hierarchy that will normally be the one you have in your electrical diagrams.


energy-monitor-using-optix_Step 4_1.png

energy-monitor-using-optix_Step 4_1


Step 4.2

In the Model > Variables > Electric folder, all the Objects associated with the 17 meters we have considered are created, with the same structure that we have handled: name, kw, v, i.

energy-monitor-using-optix_Step 4_2.png

energy-monitor-using-optix_Step 4_2

Step 5
 

Step 5

We generate the screens of the different levels we have in the plant for energy measurement:

  • Main
  • Substations
  • Areas: Lines and Auxiliar
  • Machines, MCC, Compressor
  • Motor (engine)

In the Levels folder we have the Panels for creating the different levels:

  • Sub
  • Areas
  • Machines
  • Devices

In this case, they are the Faceplates called ElectricFaceplate that we associate with each meter as appropriate with Meter Objects.


Step 5.1

For the Panel Sub we created two meters

  • Sub1 associated meter1
  • Sub2 associated meter2
 
energy-monitor-using-optix_Step 5_1.png

energy-monitor-using-optix_Step 5_1


Step 5.2

For the Panel Area we created 5 meters:

  • Line1 associated meter3
  • Line2 associated meter4
  • Line3_1 associated meter5
  • Line3_2 associated meter6
  • Auxiliars associated meter7
 
energy-monitor-using-optix_Step 5_2.png

energy-monitor-using-optix_Step 5_2


And so on with the other Panels for the following levels and meters.

  • Machines
  • Devices
Step 6
 

Data to the HTML webpage.

In the EnergyMonitoring > ProjectFiles > Sankey folder, we have our sample files for an HTML webpage to display data in the Sankey chart.

It's important to mention that the charts or libraries for the HTML webpage can be developed at your convenience or obtained from other templates. This is just an example to show how to send data to the webpage.

There are two files:

  • Sankey.html – which we will be continually reviewing
  • Template-Sankey.html – which helps us send data from Optix
  • Step 6.1


    Sankey.html will be the file where we'll review the data to analyze it in the Sankey chart.


    Here we see the structure of how our Sankey chart will be defined, practically according to our hierarchical levels.

     
    energy-monitor-using-optix_Step 6_1.png

    energy-monitor-using-optix_Step 6_1

  • Step 6.2


    Template-Sankey.html will be the file we'll use to build our HTML website with the Optix data.


    We'll primarily name the variables $01, $02, and $17, associating them with the meters we created in our Optix application.


    energy-monitor-using-optix_Step 6_2.png

    energy-monitor-using-optix_Step 6_2

  • Step 6.3


    In our Optix application in the UI > MainWindow folder we will find our RuntimeChartHTML, which is a NetLogic to send the Optix data to the HTML web page, written in C#.

     
    energy-monitor-using-optix_Step 6_3.png

    energy-monitor-using-optix_Step 6_3

  • Step 6.4


    Reviewing the C# code for RuntimeChartHTML, we find the block where we associate the variables from our HTML page with the objects created in Optix.


    $01 associated with the Optix data from the meter1/kw object.

    Since what we will analyze on the HTML page in the Sankey chart is kw.


    energy-monitor-using-optix_Step 6_4.png

    energy-monitor-using-optix_Step 6_4

Step 7
 

We also created Faceplates to be able to manually structure our hierarchy in a Panel for the Energy layout.

energy-monitor-using-optix_Step 7.png

energy-monitor-using-optix_Step 7

Step 8
 
  • Step 8.1


    Run the application and you'll be able to see the simulated energy consumption measurements (you can later link them to your real meters).


    First, the energy layout.

     
    energy-monitor-using-optix_Step 8_1.png

    energy-monitor-using-optix_Step 8_1

  • Step 8.2


    Substation

     
    energy-monitor-using-optix_Step 8_2.png

    energy-monitor-using-optix_Step 8_2

  • Step 8.3


    Areas

     
    energy-monitor-using-optix_Step 8_3.png

    energy-monitor-using-optix_Step 8_3

  • Step 8.4


    Machines

     
    energy-monitor-using-optix_Step 8_4.png

    energy-monitor-using-optix_Step 8_4

  • Step 8.5


    Devices

     
    energy-monitor-using-optix_Step 8_5.png

    energy-monitor-using-optix_Step 8_5

  • Step 8.6


    Sankey HTML

     
    energy-monitor-using-optix_Step 8_6.png

    energy-monitor-using-optix_Step 8_6

Step 9
 

In your project folder, EnergyMonitoring > ProjectFiles > Sankey, you can open the Sankey.html page and view the data from a browser to analyze the Sankey chart.


You can view the data sent directly from Optix to the HTML page and analyze it.

energy-monitor-using-optix_Step 9.png

energy-monitor-using-optix_Step 9


energy-monitor-using-optix_Step 1.png

energy-monitor-using-optix_Step 1

energy-monitor-using-optix_Step 2_1.png

energy-monitor-using-optix_Step 2_1

energy-monitor-using-optix_Step 2_2.png

energy-monitor-using-optix_Step 2_2

energy-monitor-using-optix_Step 3_1.png

energy-monitor-using-optix_Step 3_1

energy-monitor-using-optix_Step 3_2.png

energy-monitor-using-optix_Step 3_2

energy-monitor-using-optix_Step 4_1.png

energy-monitor-using-optix_Step 4_1

energy-monitor-using-optix_Step 4_2.png

energy-monitor-using-optix_Step 4_2

energy-monitor-using-optix_Step 5_1.png

energy-monitor-using-optix_Step 5_1

energy-monitor-using-optix_Step 5_2.png

energy-monitor-using-optix_Step 5_2

energy-monitor-using-optix_Step 6_1.png

energy-monitor-using-optix_Step 6_1

energy-monitor-using-optix_Step 6_2.png

energy-monitor-using-optix_Step 6_2

energy-monitor-using-optix_Step 6_3.png

energy-monitor-using-optix_Step 6_3

energy-monitor-using-optix_Step 6_4.png

energy-monitor-using-optix_Step 6_4

energy-monitor-using-optix_Step 7.png

energy-monitor-using-optix_Step 7

energy-monitor-using-optix_Step 8_1.png

energy-monitor-using-optix_Step 8_1

energy-monitor-using-optix_Step 8_2.png

energy-monitor-using-optix_Step 8_2

energy-monitor-using-optix_Step 8_3.png

energy-monitor-using-optix_Step 8_3

energy-monitor-using-optix_Step 8_4.png

energy-monitor-using-optix_Step 8_4

energy-monitor-using-optix_Step 8_5.png

energy-monitor-using-optix_Step 8_5

energy-monitor-using-optix_Step 8_6.png

energy-monitor-using-optix_Step 8_6

energy-monitor-using-optix_Step 9.png

energy-monitor-using-optix_Step 9.png


Energy Monitoring using FT Optix

Version 1.2 - June 2026


AHIC White Logo
Subscribe!

Receive new app releases and other updates from the Innovation Center directly in your inbox.

I want to subscribe.
 
  1. Chevron LeftChevron Left Rockwell Automation Home
  2. Chevron LeftChevron Left Sup...
  3. Chevron LeftChevron Left Pro...
  4. Chevron LeftChevron Left Downloads
  5. Chevron LeftChevron Left Innovation Center
  6. Chevron LeftChevron Left Energy Monitoring using FT Optix
Please update your cookie preferences to continue.
This feature requires cookies to enhance your experience. Please update your preferences to allow for these cookies:
  • Social Media Cookies
  • Functional Cookies
  • Performance Cookies
  • Marketing Cookies
  • All Cookies
You can update your preferences at any time. For more information please see our {0} Privacy Policy
CloseClose