Loading
Blog
Recent ActivityRecent Activity

Beyond Automation: Gain Brewhouse Efficiency with Process Analytics

Share This:

LinkedInLinkedIn
TwitterTwitter
FacebookFacebook
PrintPrint
EmailEmail
Main Image
Blog
Recent ActivityRecent Activity
Beyond Automation: Gain Brewhouse Efficiency with Process Analytics

Share This:

LinkedInLinkedIn
TwitterTwitter
FacebookFacebook
PrintPrint
EmailEmail

We’ve seen great advancements in brewing technology and adoption of automation in the past 20 years. This focus on brewhouse efficiency has helped increase yield from raw materials, save on batch cycle times and improve quality for brewers of all sizes.

Chances are you’re already operating a modern automated brewery that reliably does what it’s programed to do. But, is that enough? Is it driving continuous improvement or telling you how to get better?

Your Next Step in Brewhouse Efficiency

Once a solid and proven automation system is in place, harnessing the power of process analytics is the next frontier in brewing efficiency.

For instance, does your current system provide dashboards and historical reports to easily compare batches? It should. Gaining visibility to data points in your brewery lets you monitor the current and past process and improve on it. It also allows operators to put down the clipboard and become less dependent on manual calculations that slow things down.

Collecting and analyzing data from across your operation doesn’t have to be an overwhelming undertaking, it’s just smart brewing. Start by looking at your process today, identify the biggest bottlenecks and tackle those first. You can always scale up from there as you realize success.

On the left of this chart you see the free rise of heat after yeast is introduced. Temperature is maintained between the high and low setpoint for the duration of fermentation and curves downward when cooling is introduced, slowing down the yeast. If your fermentation profiles are not consistent from brew to brew, analytics can help identify areas for improvement. (Click image to enlarge).

A Closer Look at the Fermentation Process

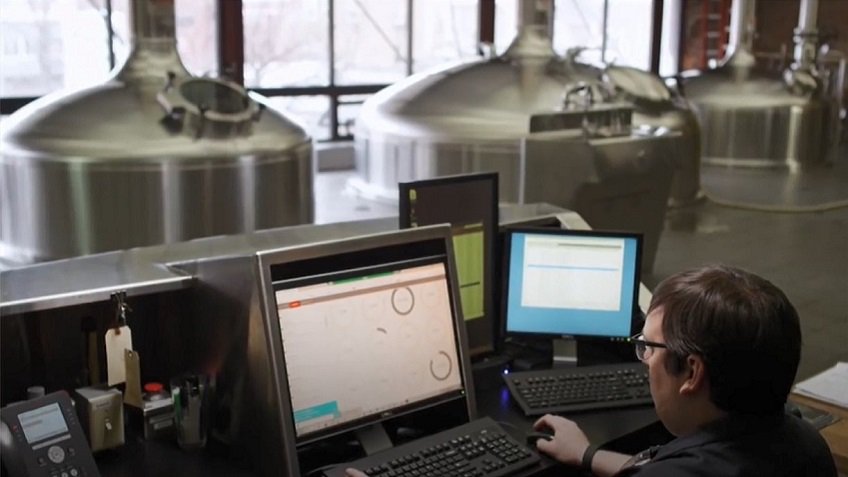
One area that represents an opportunity for greater batch efficiency is the fermentation process. And the better you understand and control variables like time, temperature, balling and cooling capacity, the better the fermentation process will be.

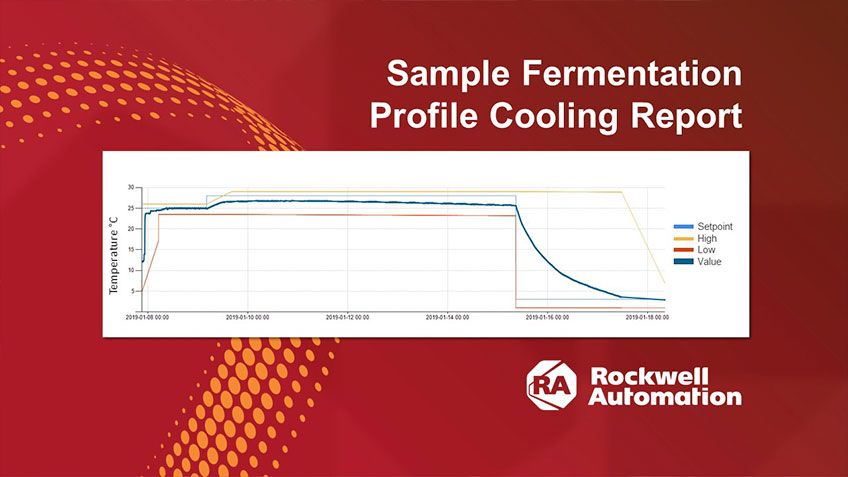
You already know your general fermentation profile for a given recipe, such as an ale set at 65°F for 10 days. Impacting those variables are set points for temperature control, cool on time, fill volume and primary fermentation time that follow a recipe that has worked before, so you continue to use it.

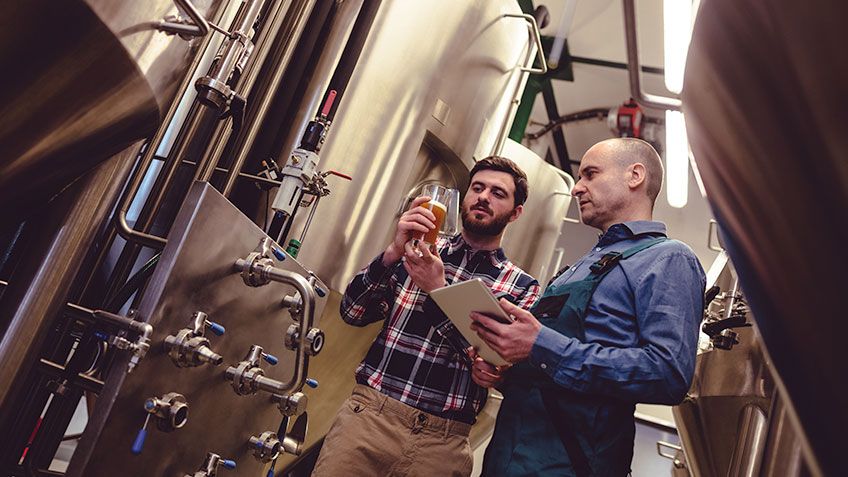
But what if you can hit these targets in less time? Predictive analytics can reveal hidden efficiencies that are easily attainable for any operation.

Maybe your recipe calls for a batch to sit in fermentation for 10 days to get the desired Plato. But in actuality, you can do it in 8 days and still get the same alcohol content and taste profile. Manual monitoring may not accurately identify this trend, but an analytic watching trending data can alert you to this 2 day recipe change that can have a domino effect on capacity and overall brewhouse efficiency.

Video: FactoryTalk Brew and FactoryTalk Craft Brew Demo. Learn about our flexible, scalable brewing solutions for all sized breweries.

Sustainable Brewing

There are many other opportunities, from milling to finishing tanks, to make data-driven process improvements and eliminate waste from beer production. Looking at fermentation and lautering are the more obvious places to start. But we’ve seen breweries benefit from analytics on the periphery as well, like utilities.

Some of these brewers are more mature and are looking for the next untapped brewhouse efficiency. Other trends at play are sustainable brewing efforts and a desire to be a good corporate citizen while running a very water and heat intensive process.

Deeper insight into this area can have a big impact. Think about it. Do you know how much water and heat is used in your CIP (clean in place) process? By analyzing time, temperature and flow data, you can reduce rinse and sterilization time and temperature, and significantly reduce water and heat usage without impacting quality.

Video: Sleeman Brewing increased production capacity by 50% in 2 weeks. Watch this video for a behind the scenes look at their operations.

Conclusion

The industry is still discovering what process analytics can do. But the vision of greater brewhouse efficiency is real. Just look at the domino effect that even a five minute savings on any step in the process can have batch after batch, brew after brew throughout the year.

Because this is uncharted territory to many brewers, working with the right partner will be important. Consider those that offer package solutions from the sensors through the software level plus analytics. And of course, deep expertise in brewing and other process-intensive industries.

There are always new areas in today’s automated brewery we’re reviewing and analyzing. But we want to hear from you! Let us know what your greatest challenges are so we can focus on the solutions most important to your operation.

Published March 25, 2019

Tags: Food & Beverage

Greg Hood
Greg Hood
Brewing Solutions & Applications Business Development Manager, Rockwell Automation
Connect:
EmailEmail
Subscribe

Subscribe to Rockwell Automation and receive the latest news, thought leadership and information directly to your inbox.

Subscribe

Recommended For You

Loading
  • Sales
  • Customer Care
  • TechConnect Support
  • General Questions
  1. Chevron LeftChevron Left Home Chevron RightChevron Right
  2. Chevron LeftChevron Left Company Chevron RightChevron Right
  3. Chevron LeftChevron Left News Chevron RightChevron Right
  4. Chevron LeftChevron Left Blogs Chevron RightChevron Right