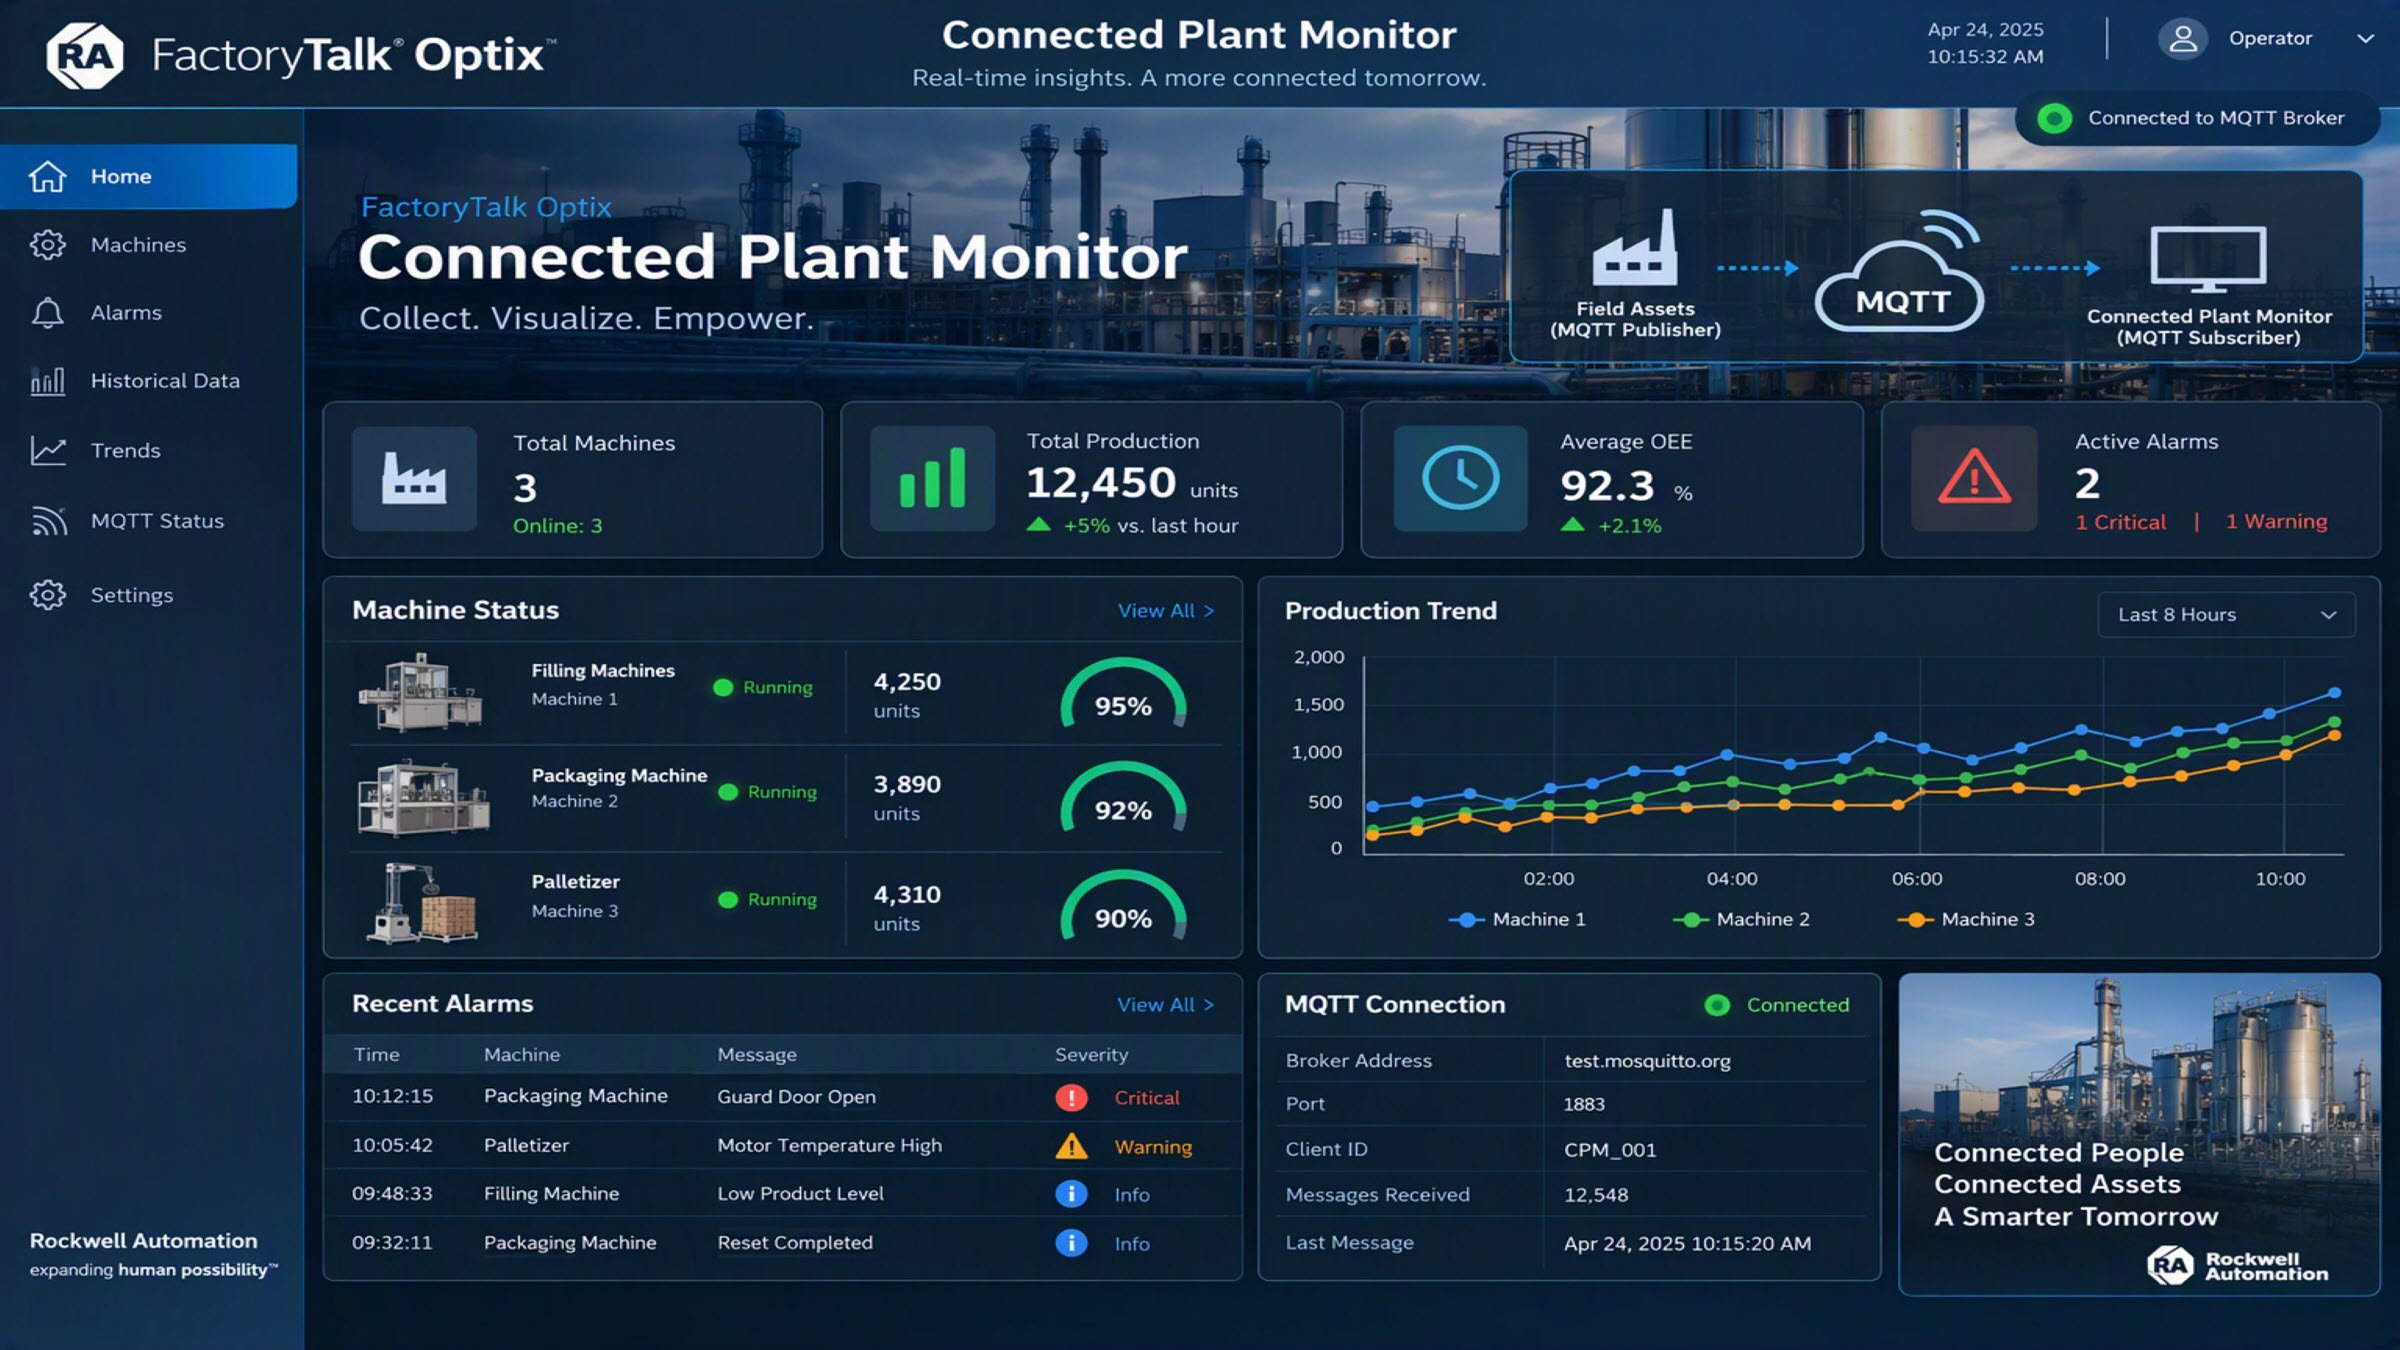
Connected Plant Monitor connects industrial plant data through FTOptix and MQTT, enabling real-time operational monitoring across machines and sites. - [Implementation Time: 120 Minutes]
The Connected Plant Monitor application is a demonstration project built in FactoryTalk Optix that shows how industrial data can be collected and visualized using the MQTT communication protocol. The Connected Plant Monitor application is used to collect, consolidate, and visualize real-time and historical industrial data transmitted via MQTT from one or more field applications, providing a centralized dashboard for monitoring plant or machine information.
Demonstration MQTT broker. The example uses the public broker test.mosquitto.org, which is intended only for demonstration purposes and does not guarantee availability, security, or performance.
No built-in enterprise historian. The example demonstrates MQTT data forwarding and visualization but does not provide the advanced capabilities of dedicated industrial historians such as long-term archiving, compression, redundancy, or enterprise analytics.
Dependent on MQTT infrastructure. Communication reliability depends on broker availability, network connectivity, topic configuration, and QoS settings.
Downloads
Please note: You will need to agree to the Terms & Conditions for each download.
If the connection with the MQTT_Asset is working, the “Live Data” LED will be green.
connected-plant-monitor_LiveData_4.png
The data exchange is based on a Runtime Netlogic which can be found in the Netlogic folder. The Netlogic MQTTBrokerLogic is present on both applications but is configured differently.
The data exchange is based on a Runtime Netlogic which can be found in the Netlogic folder. The Netlogic MQTTBrokerLogic is present on both applications but is configured differently.
Here the Runtime Netlogic works as Subscriber: subscribing to the topics on which the Field Application publishes, it shows all data in the form of a dashboard.
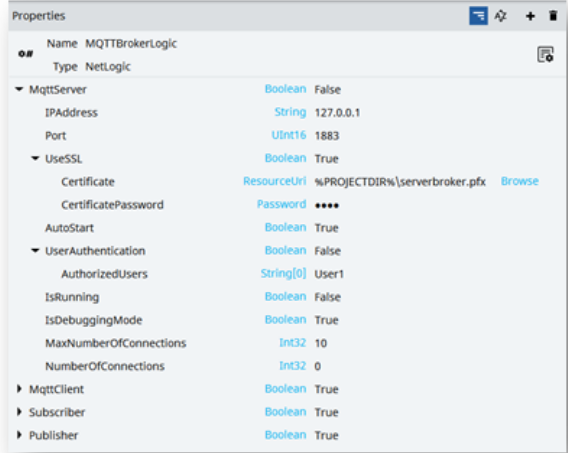
It should be activated (TRUE) only if you want to use your Uniqo application as a Broker (hence not using an existing MQTT broker, in this example test.mosquitto.org).
connected-plant-monitor_MQTT_Server_7.png
Parameters:
IPAddress: IP address where the Broker will be instantiated
Port: number of the port on which the broker is listening
UseSSL: enables the use of certificates
Certificate
CertificatePassword
AutoStart LEAVE TRUE
UserAuthentication: if true only the specified users can access
AuthorizedUsers
IsRunning: Server status
IsDebuggingMode NOT USED
MaxNumberOfConnections: maximum number of clients that can connect to the Broker
NumberOfConnections: number of active connections
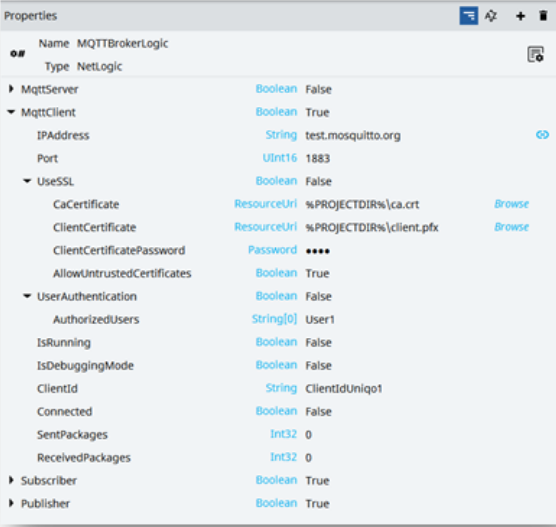
MQTT Client
It must always be active (TRUE) because it is the connection with the Broker to which you publish or to which you subscribe. If you want to connect two applications, you need to set the same broker and the same port on both projects. Instead, the ClientID parameter must be different (unique) on each application.
connected-plant-monitor_MQTT Client_8.png
Parameters:
IPAddress: broker address (test.mosquitto.org) could be external like in this case, or internal if the application work as a broker (e.g., MQTTBrokerLogic.MQTTServer.IPAddress)
Port: broker port (1883 for test.mosquitto.org)
UseSSL: Switch to TRUE if the broker requires certificates
CaCertificate
ClientCertificate
ClientCertificatePassword
AllowUntrustedCertificates
UserAuthentication: Switch to TRUE if the broker requires authorized users.
AuthorizedUsers: String array which contains Uniqo users (User1; User2; User […]);
IsRunning NOT USED
IsDebuggingMode NOT USED
ClientId: this is the unique Id, different for each application that wants to participate in the data sharing/exchange
Connected: connection status to the broker
SentPackages STATS
ReceivedPackages STATS
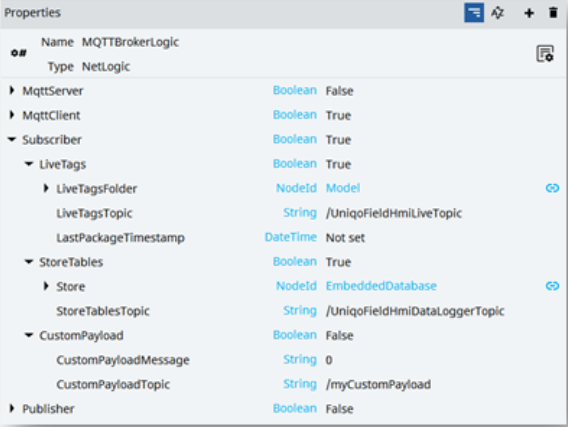
Subscriber
It must be active (TRUE) if your application needs to receive data published on the broker.
connected-plant-monitor_Subscriber_9.png
Parameters:
LiveTags: TRUE = receive LIVE DATA
LiveTagsFolder: this folder/Node contains a copy of the Publisher LiveTagsFolder parameter, on which the Netlogic will copy the values read from the broker.
LiveTagsTopic: on this parameter needs to be specified the topic on which you are subscribed, and you want to receive live variables/tags values.
LastPackageTimestamp: Timestamp of the last published packet
StoreTables: TRUE = receive HISTORICAL DATA
Store: DataStore on which we are saving received data. The store’s tables must be renamed with the “TablesPrefix” parameter, plus the name of the publisher application tables. Below is an example:
Subscriber application DataStore table names: Station1_DataLogger, Station1_EventLogger Verify to have the same columns you have on the Publisher application
StoreTablesTopic: on this parameter needs to be specified the topic on which you are subscribed, and you want to receive historical variables/tags values.
CustomPayload: Custom message without pre-defined format
CustomPayloadMessage: Custom text message from the CustomPayloadTopic
CustomPayloadTopic: On this parameter needs to be specified the topic on which you are subscribed, and you want to receive custom messages.
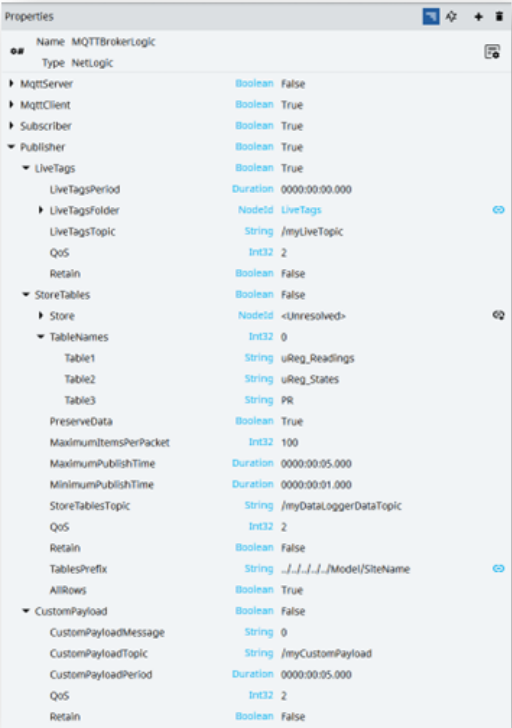
Publisher
It must be active (TRUE) if your application needs to publish data to the broker.
connected-plant-monitor_Publisher_10.png
Parameters:
LiveTags: TRUE = publish LIVE DATA
LiveTagsPeriod: Sending frequency (if 0000:00:00.000 send data on value change).
LiveTagsFolder: folder (or node) that contains data to be sended
LiveTagsTopic: /UniqoFieldHmiLiveTopic is the topic on which we are sending/publishing data
QoS: MQTT Quality of Service (0,1,2)
Retain: Retain message on the topic even after read
StoreTables: TRUE = publish HISTORICAL DATA
Store: DataStore on which we are saving our data
TableNames: Store tables to be sended
Table1: Datalogger
Table2: AlarmsEventLogger
Table (…) could be added or removed
PreserveData NOT USED
MaximumItemsPerPacket: define how many rows per packet to send
MaximumPublishTime: Maximum waiting time before publishing data even if not reached the MaximumItemsPerPacket value.
MinimumPublishTime: Minimum waiting time before publishing data when the MaximumItemsPerPacket value is reached.
StoreTablesTopic : /UniqoFieldHmiDataLoggerTopic is the topic on which we are sending/publishing data
QoS: MQTT Quality of Service (0,1,2)
Retain: Retain message on the topic even after read
TablesPrefix: A model variable containing the hypothetical name of different production sites, in this case, will be “Station1”. Into the sent packet will appear the table sent with the unique prefix corresponding to the right machine/site from which the packet arrives (Station1_AlarmsEventLogger). This is useful when we have more than one of the same machine model/more than one of the same plant configurations and we need to distinguish from which machine/plant data arrives.
AllRows: When is TRUE, publish all the data already present in the Store Tables. Set on FALSE to publish only the data stored after the implementation of the MQTTBrokerLogic.
CustomPayload: Custom message without pre-defined format
CustomPayloadMessage: Custom text message published to the CustomPayloadTopic
CustomPayloadTopic: The topic on which the message will be published
CustomPayloadPeriod: Sending frequency of the custom message (if 0000:00:00.000 send data on value change)
QoS: MQTT Quality of Service (0,1,2)
Retain: Retain message on the topic even after read
Connected Plant Monitor
Version 1.0 - October 2026
Receive new applications and Innovation Center updates directly in your inbox.