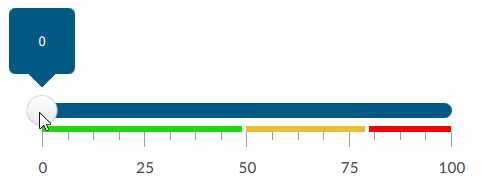
Linear gauge example
Use this object to set and display a whole number value within a range of possible values.
Linear gauge example
Use case
Set or display the value of an analog variable within a minimum and maximum value.
TIP:
Use the
Tooltip
property to show or hide the display of the value above the selection point on the gauge. Use the Warning zone
property to display specific ranges of values in different colors.Provide Feedback